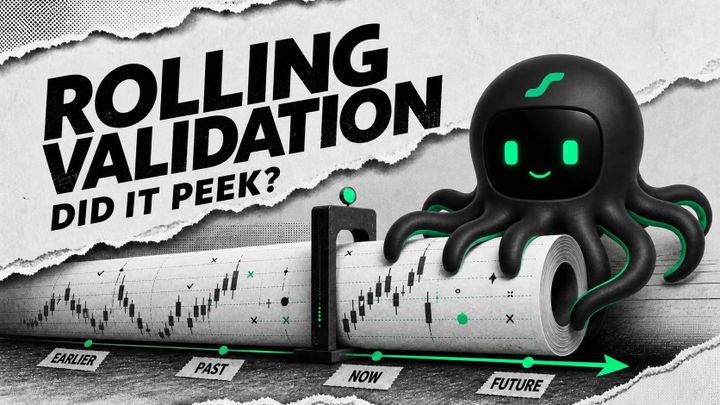
Same Trend, Different Result: Why Quant May Profit While Retail Loses
The same buy-after-a-rise trade can end very differently. The difference is not the quant label—it is rules, sizing, costs, and execution.
Short answer: Quantitative strategies and discretionary traders may both buy after prices rise and sell after they fall. Their outcomes differ because the label does not create an edge. What matters is whether the rule has evidence behind it, position risk is controlled, costs are modeled, and execution remains consistent. A bad rule does not improve when automated; it simply loses more consistently.
The trades can look identical while the process is not
A market rises and both traders buy. It falls and both sell. One screenshot can make the two approaches look interchangeable.
Trading, however, is not one screenshot. It is a full ledger. Two restaurants both buy ingredients, cook food, and serve customers; one makes money and the other closes. The difference lives in purchasing costs, portions, waste, pricing, and whether the owner rewrites the menu on a whim.
Systematic trend following works the same way. It should define what counts as a trend, when to enter, how much to risk, when to exit, and how fees and slippage are handled before the trade begins.
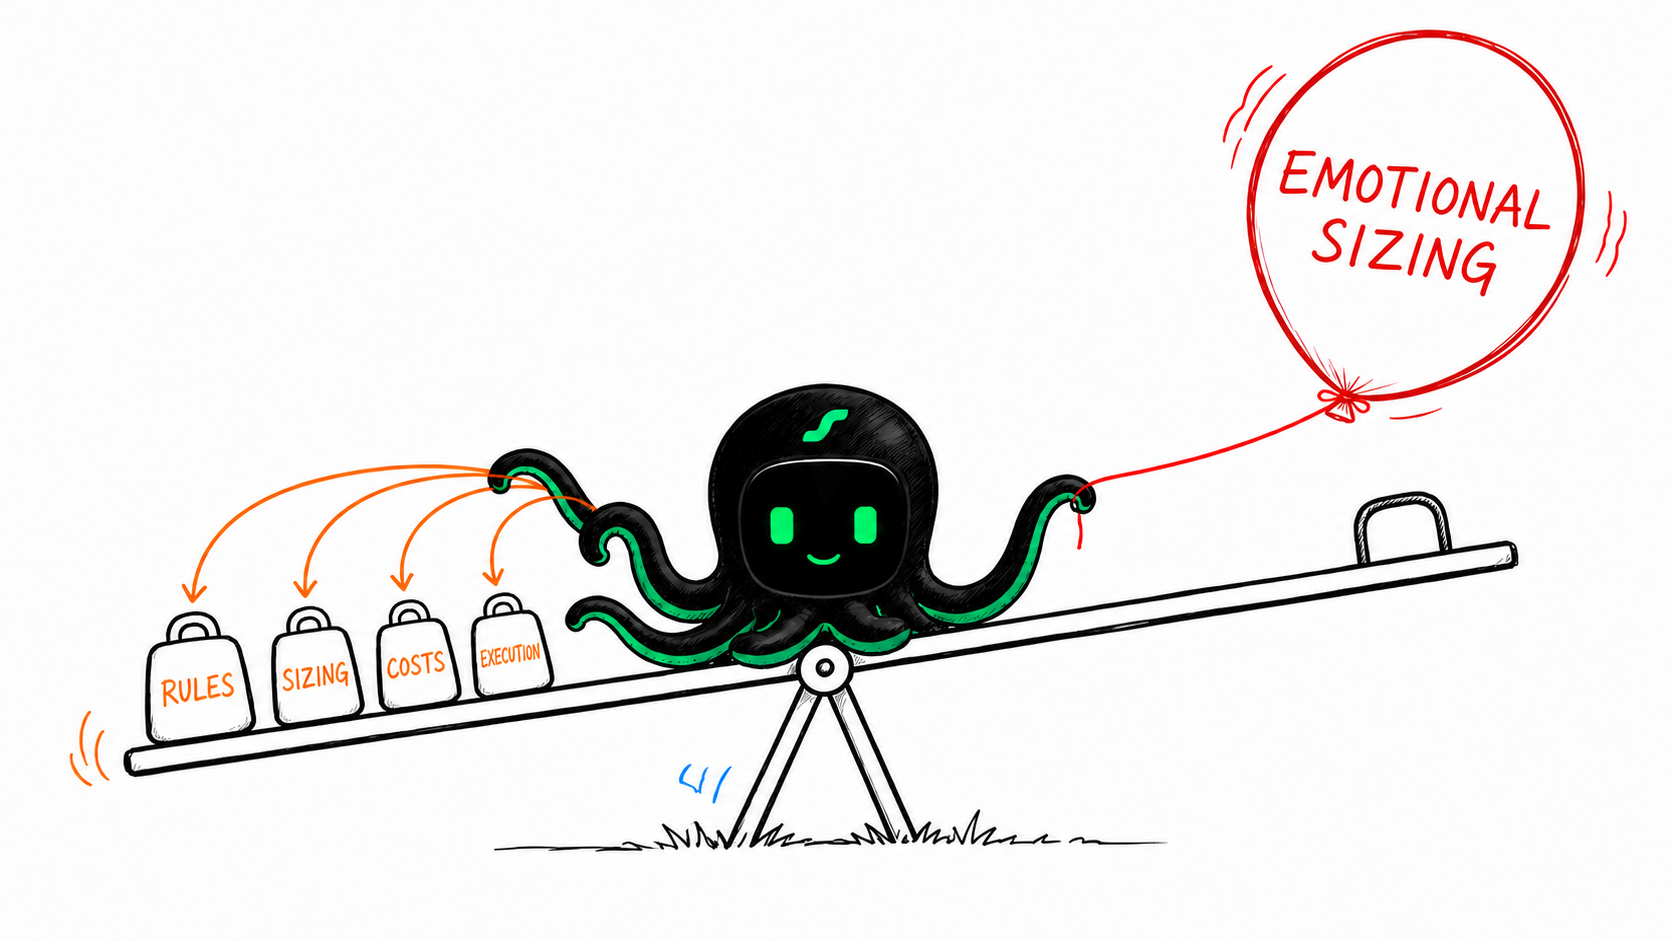
Systematic traders buy rules; impulsive traders often buy a feeling
A systematic strategy defines its signal first and applies the same test to each opportunity. Impulsive performance chasing often reverses that order: the move creates urgency, then the trader invents a reason to justify the urge.
This is not a claim that humans lack discipline or that software possesses an edge. A discretionary trader can follow a repeatable process, while an algorithm can encode nonsense. The useful dividing line is whether the rule can be written before the trade and reproduced afterward.
Trend effects are not purely imaginary. Research by Moskowitz, Ooi, and Pedersen across 58 futures and forward markets found that an instrument’s past 12-month excess return positively predicted its future return, with the effect lasting about a year before partly reversing over longer horizons. That is historical statistical evidence—not a promise that an asset rising today must rise tomorrow. Research data and methodology
Profit is not the win rate; it is the shape of wins and losses
Imagine two traders who each make ten trades and win only 40% of them.
Trader A loses 1% when wrong and gains 2% when right. Trader B lets losses grow to 2% but takes profits at 1%. Ignoring compounding, A finishes at 4 × 2% − 6 × 1% = +2%. B finishes at 4 × 1% − 6 × 2% = −8%.
Same win rate. A ten-percentage-point difference. This is an illustration, not a return forecast. It shows why a strategy must be judged by its full distribution, not by how often it guesses correctly.

Behavioral research offers one reason the distributions diverge. Terrance Odean studied roughly 10,000 brokerage accounts and found that investors showed a strong preference for realizing winners while holding losers longer; subsequent performance did not justify that behavior. Paper and abstract
Costs hide from the headline, not from the equity curve
Trend strategies endure false breakouts and rapid reversals. Each position change can incur commissions, bid–ask spread, slippage, and—in perpetual futures—funding. A backtest using ideal fills can look immaculate. Live costs arrive with the reliability of rent.
This is why “quant makes money” is the wrong conclusion. Good research incorporates trading costs and tests whether a result survives different parameters, markets, and unseen periods. Bad research searches history until it finds a beautiful curve. Work by Gârleanu and Pedersen explicitly treats forecasts, risk, correlation, and transaction costs as one optimization problem rather than pretending turnover is free. Research overview

When does quant lose with impressive consistency?
It loses when markets repeatedly reverse, when a backtest is overfit, when sizing is too aggressive, or when liquidity and execution conditions change. Code can follow an old rule perfectly; it cannot prove that the old rule still has an edge.
How can a retail trader turn chasing into a testable strategy?
- Define the signal: replace “it feels like a breakout” with a reproducible price, moving-average, or volatility condition.
- Write the exit first: specify the stop, target, or reversal signal before entering.
- Fix risk per trade: derive position size from an acceptable account loss, not from excitement.
- Model all costs: include fees, slippage, and funding where relevant.
- Use unseen data: choose parameters on one sample and validate them on another; then paper trade or run a small forward test.
- Record deviations: missed signals and unplanned trades belong in the journal. Otherwise, the test measures mood rather than strategy.
EdgePilot can turn a feeling into a ledger you can inspect
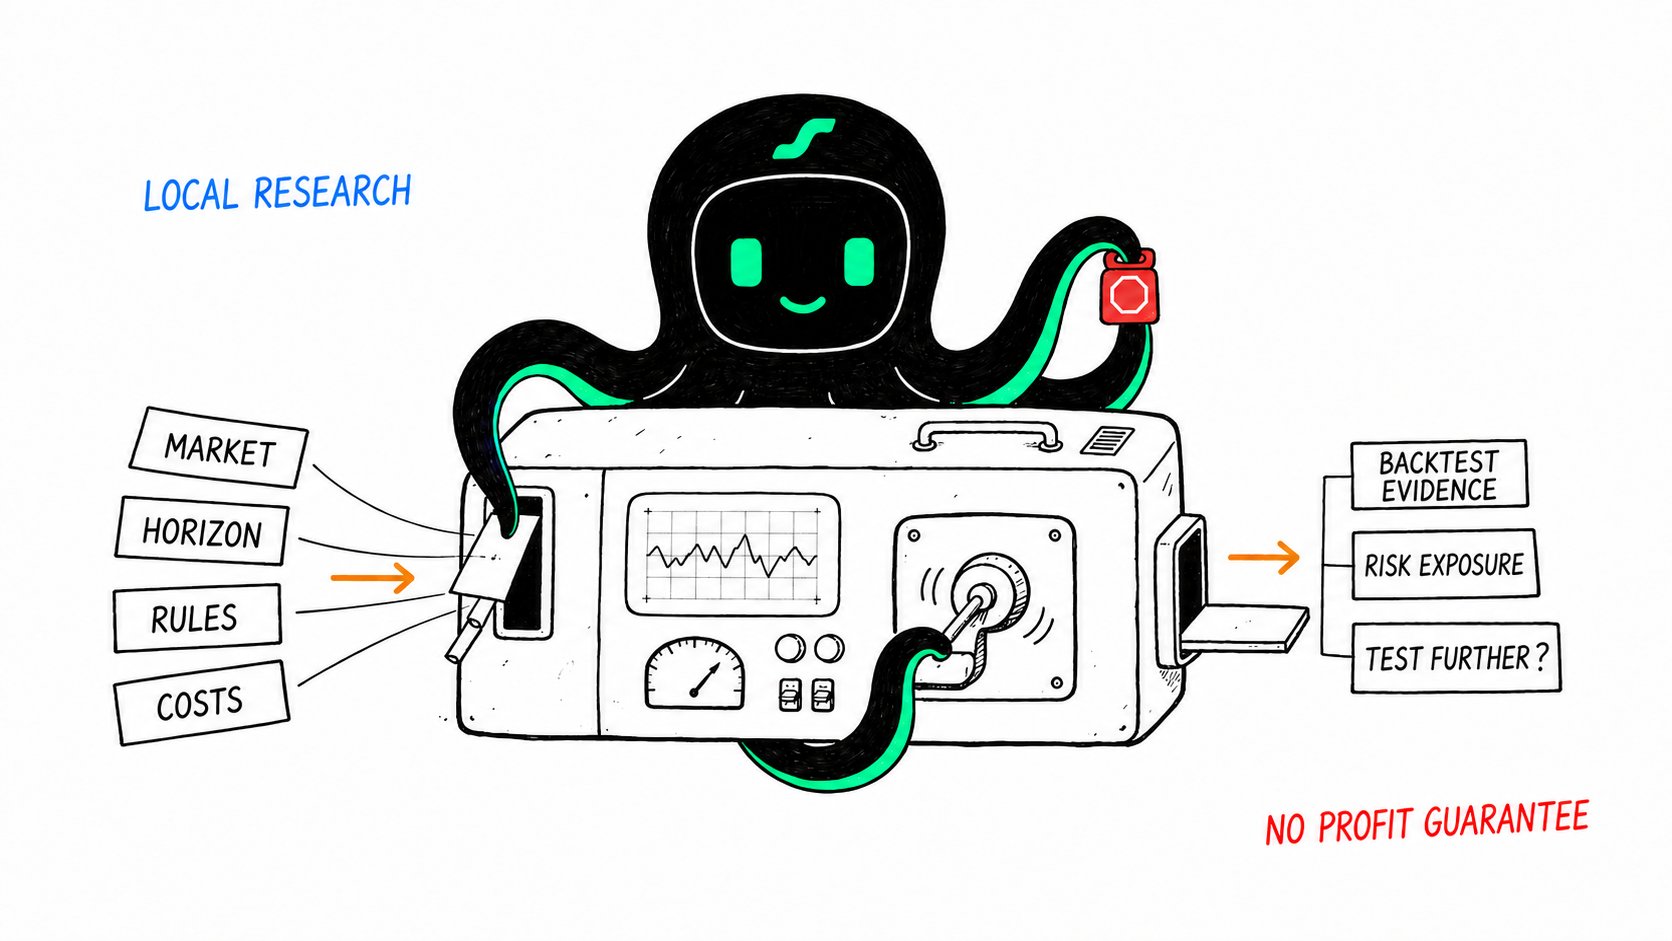
EdgePilot Research fits after that checklist. Give it the market, horizon, entry and exit rules, and cost assumptions; it helps you run a local historical backtest and puts returns, drawdown, risk-adjusted performance, and out-of-sample behavior in front of you. You do not need to build an entire research stack before you can test whether an idea deserves another look.
If you want to know whether your “trend strategy” is a rule or just adrenaline with a spreadsheet, run it through EdgePilot Research and see what survives realistic costs and unseen data. It is historical research, not a profit guarantee—but it can stop a feeling from dressing up as evidence.
The conclusion: quant does not create gold; it exposes the ledger
A quantitative trend strategy may make money when its rules possess a statistical edge under specific market, horizon, and cost assumptions—and when sizing and execution allow that edge to survive. Retail traders may lose not because “buying strength and selling weakness” is inherently foolish, but because signals drift, losses expand, profits are cut, costs disappear, and discipline changes mid-trade.
The reverse is equally important: without an edge, automation only scales the mistake. The useful questions are whether the rule is reproducible, costs are realistic, risk is bounded, and results survive unseen data.
This article is for trading research and education only. It is not investment advice. Historical tests and illustrative examples do not predict future returns.
FAQ
Is buying after a rise and selling after a fall always wrong?
No. Trend following often does exactly that. Its success depends on signal definition, payoff structure, costs, diversification, and execution—not on whether the action sounds clever.
Do quant strategies always have higher win rates?
No. Many trend strategies rely on a small number of large winners covering frequent small losses. Win rate alone ignores average gains, average losses, and tail risk.
Does a retail trader need full automation?
No. Start with EdgePilot Research: discover an inspectable strategy idea, define entry, exit, sizing, and cost assumptions, run a local historical backtest, and compare returns, drawdown, and out-of-sample behavior. First decide whether the strategy deserves further testing. Automating orders before that only makes an untested idea move faster.
Sources
- Moskowitz, Ooi & Pedersen, Time Series Momentum: Original Paper Data.
- Odean, Are Investors Reluctant to Realize Their Losses?
- Gârleanu & Pedersen, Dynamic Trading With Predictable Returns and Transaction Costs.