Can Quant Trading Turn a Small Edge Into a Big One Just by Trading More?
More trades can build a small quantitative edge—or grind an account down faster. The difference is what each trade leaves after costs.
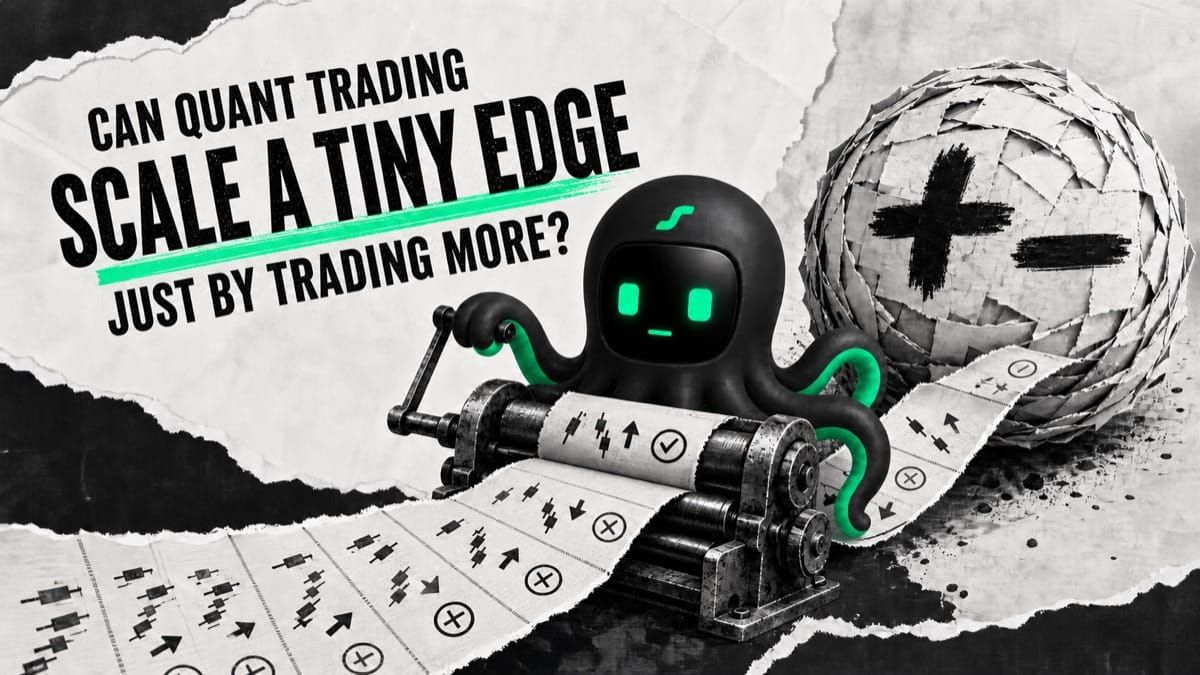
Short answer: Yes—but only if each trade still makes money after fees and slippage. If every trade loses a little, doing it more often does not rescue the strategy. It just drains the account faster. Before you get excited about frequency, check whether one complete trade earns money or merely keeps the exchange well fed.
Quant trading has its own version of a motivational poster: a tiny edge is enough. Repeat it a thousand times and the edge will snowball.
That is only half true. Casinos are happy to let you keep playing because they worked out the odds first. Traders often reverse the order: run more trades now, ask whether the strategy has an edge later.
Here is the plain-English version: trade count is an accelerator, not an engine. Point the car the right way and it gets you there faster. Point it at a wall and, well, it also gets you there faster.
Forget the win rate for a minute. Finish the bill.
Start with three numbers: how much you make when you win, how much you lose when you lose, and what the entire round trip costs. What remains, on average, is what researchers call net expectancy.
Net expectancy per trade = win rate × average win − loss rate × average loss − total trading cost
Total cost is not just the fee printed on an exchange page. Spread, slippage, funding, and market impact can all take a bite. Investor.gov makes the same basic point: fees reduce returns, and performance claims should be checked for the costs they include or quietly leave out. How fees affect returns How to read performance claims
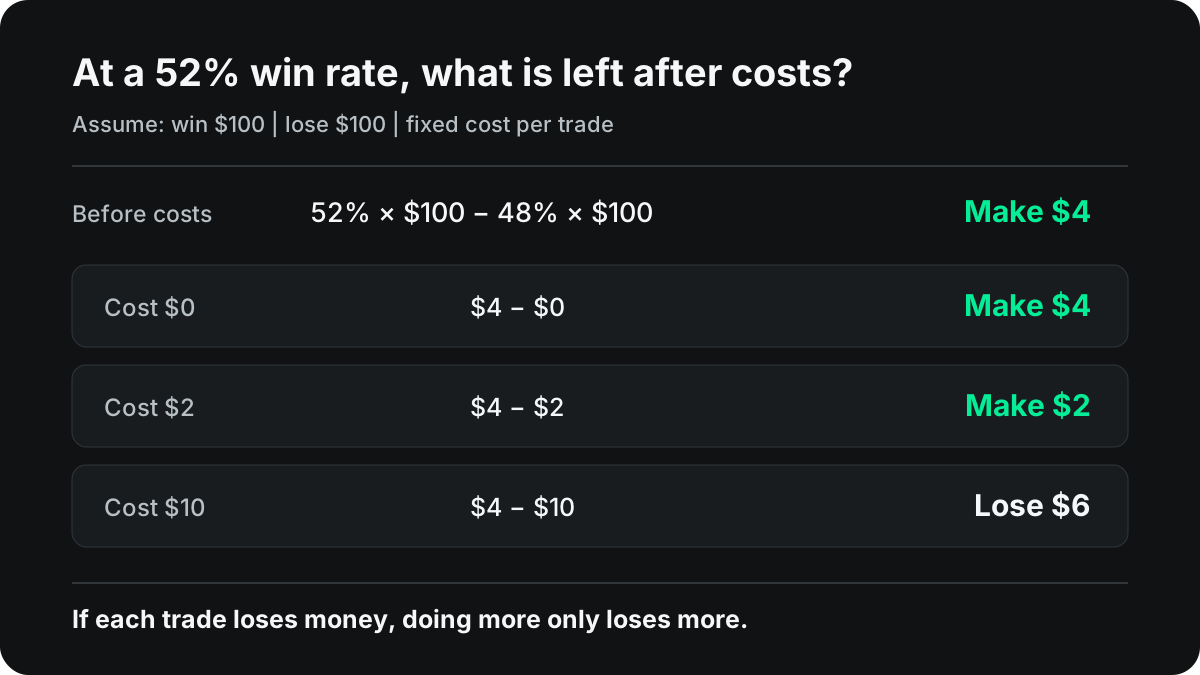
Let us use dollars—no made-up units required. Suppose a winning trade makes $100, a losing trade loses $100, and the win rate is 52%.
- No trading cost: 52% × $100 − 48% × $100 = +$4 per trade.
- $2 cost per trade: the average falls to +$2.
- $10 cost per trade: the average becomes −$6.
The win rate stayed at 52%. The strategy still flipped from earning money to paying rent to the market. More trades simply multiply whichever number is left after costs.
What does trading more actually change?
More trades can help you see whether a strategy has anything under the hood. That only works when the rules stay roughly consistent and the trades are not all copies of the same market event.
If the sample grows fourfold, the random wobble around an average usually shrinks by about half—not by three quarters. In research, this is the familiar relationship between sample size and the standard error of the mean. NIST calculation reference
In normal language: more observations can make the answer easier to see. They cannot turn a wrong answer into a right one.
Using the same 52% win rate and $100 wins and losses, the chance of finishing above zero changes like this:
| Cost per trade | Average per trade | Positive after 25 | Positive after 100 | Positive after 400 |
|---|---|---|---|---|
| $0 | +$4 | 58.0% | 61.8% | 77.4% |
| $2 | +$2 | 58.0% | 54.0% | 63.7% |
| $10 | −$6 | 42.2% | 24.2% | 10.5% |
This example assumes the win rate and payoff never change, costs stay fixed, and every trade is independent. The first two rows happen to share the same 25-trade probability because both require the same whole number of wins at that small sample size. It does not mean the $2 cost vanished.
Do not memorize the table. Remember the direction: if each trade makes money on average, repetition helps the profit show up; if each trade loses money, repetition helps make the loss official.
Why real trading refuses to sit still
The arithmetic is fine. The market is the part that keeps changing the script.
1. Trades are not independent
A trend strategy can take ten losses during one choppy market. A market-making strategy can get hit repeatedly during one directional move. One hundred trades from the same asset, signal, and regime may be one market event wearing one hundred different hats.
It is like taking one patient’s temperature one hundred times. You collected plenty of numbers. You did not study one hundred people.
2. The distribution changes
Fees change. Liquidity changes. Competitors change. Volatility changes. A strategy that worked in calm markets can fall apart when prices start whipping around. If the edge died after trade 200, averaging all 400 trades together may produce nothing more than a flattering obituary.
3. More backtests can manufacture confidence
Try 500 parameter combinations on the same history and show only the winner. Of course it looks brilliant. The “champion” may not be best at trading; it may simply be best at memorizing that particular exam.
Researchers call this backtest overfitting: too many models and settings are tested against too little data, so random noise gets promoted into a trading rule. Oxford Academic: how overfitting creates false discoveries The Probability of Backtest Overfitting
So “I tested it many times” can mean two opposite things:
- The rules were frozen first, then faced more unseen data. Good.
- The rules were edited against the same history until the chart behaved. That is grading your own exam with the answer sheet open.
4. Compounding magnifies the ugly path too
If every position uses a percentage of the account, profits enlarge the next bet—but losses shrink its base. The long-run edge may be real and the account can still get carried out before it arrives if the position is too large.
Lose 20% and you need 25% to recover. Lose 50% and you need 100%. Compounding is not an up-only escalator.
When does trading more genuinely help?
The rules were written before testing. The average trade remains profitable after conservative costs. The result survives data the strategy has never seen. It works across more than one market regime. Position size is small enough that a losing streak does not knock the account flat.
When those conditions hold, a short run can be dominated by luck. Collecting more genuinely different trades can reveal a modest real edge. Quitting after three losses can be just as foolish as doubling down after three wins.
When is more trading just faster losing?
The dangerous move is not trading often. It is treating an unknown edge as a proven positive one.
A historical 52% win rate may come from thirty trades, hundreds of parameter attempts, one unusually friendly market, or results that forgot to subtract costs. Increasing frequency at that point is paying real tuition for unfinished homework.
- Freeze the entry, exit, sizing, and invalidation rules.
- Record every parameter set tried, not only the pretty one.
- Include commission, spread, slippage, and funding.
- Separate tuning data from final test data, then use paper trading.
- Check whether the profit depends on a few days, assets, or regimes.
- Collect new evidence with money you can afford to lose before scaling.
A better checklist than ‘100 trades’
Do not treat 100 trades like a graduation certificate. The number you need depends on how small the edge is, how wildly results swing, and whether those trades are actually different evidence. Ask six questions first:
- Does it still make money after every cost? Use the costs you would actually pay, not the exchange’s prettiest advertised rate.
- How easy is that profit to knock over? If one slightly worse assumption turns it negative, the edge is fragile.
- Is each trade really new evidence? One market move split into 100 entries is not 100 independent tests.
- Does it work in different markets? Check trends, ranges, high volatility, and quiet periods separately.
- How many versions did you try before finding this one? The more contestants you tested, the more luck may be hiding in the winner.
- Can the account survive long enough to find out? Look at drawdown, losing streaks, and position size—not only the average return.
Use EdgePilot Research to check the numbers
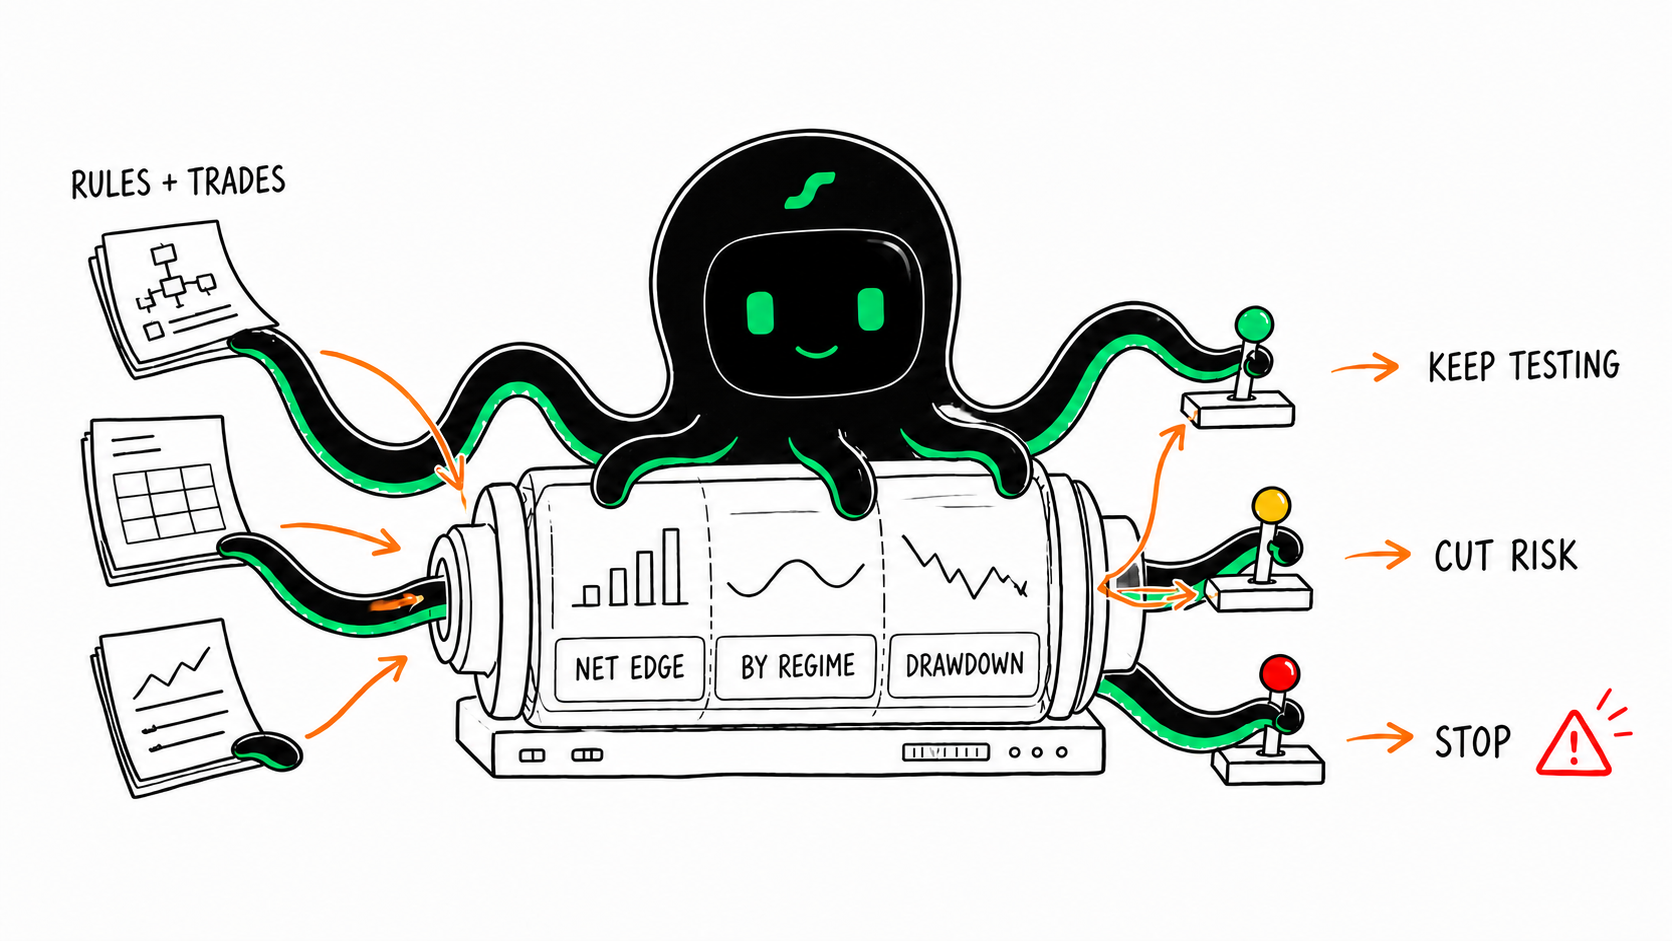
Put the trading rules, costs, historical data, and test period into EdgePilot Research. Compare the result before and after costs; see whether it survives unseen data and different market conditions; check the drawdown before deciding whether to keep testing, cut the size, or bin the strategy.
The point is simple: do not promote “this feels like an edge” into evidence. Make the numbers earn that promotion.
FAQ
Does a win rate above 50% guarantee a profitable strategy?
No. Average win, average loss, and total cost matter too. Win nine trades at $1 each and lose one trade at $20, and a 90% win rate still loses money.
How many trades are enough?
There is no magic 100-trade line. Smaller edges, noisier results, and more correlated trades require more genuinely different evidence. Test another time period and another market regime instead of worshipping the raw count.
Do more backtests make the result more reliable?
More tests on unseen data can help. Repeatedly tuning the same history until the curve looks pretty does the opposite.
Do I need full automation?
No. Automation can apply rules consistently and keep better records. It cannot bless a bad strategy. First write the rules, include every cost, and test on unseen data. Live execution is a separate risk decision.
Use the round-trip fee calculation, add a slippage sensitivity test, and then check the result with time-ordered validation.
Use the round-trip fee calculation, add a slippage sensitivity test, and then check the result with time-ordered validation.
The bottom line
Quant trading can turn a small edge into a meaningful result through repetition—but only when the edge survives costs, unseen data, changing markets, and sensible position sizing.
If each trade makes money on average, more trades may help. If each trade loses money, more trades just kill the account with better consistency. If you have not worked out which one you own, you are not compounding an edge. You are compounding the bill.
Research and risk notice: This article is educational material, not investment advice, a performance promise, or a trading instruction. All numbers are hypothetical and explain a mechanism; they do not represent any asset, strategy, or product’s actual performance.