Profitable for Hundreds of Trades, Flat After Thousands: Does the Strategy Still Work?
The first 300 trades made $3,000, but the next 2,700 lost it back. Split the backtest into two periods, then check costs, market regime, and parameter selection before rewriting the strategy.

The first few hundred trades were profitable. Then you extended the backtest to a few thousand trades, and nearly all the profit disappeared.
Testing more data was supposed to make you more confident. Instead, it left you wondering whether the strategy failed, the market changed, or trading costs quietly ate the edge.
Start by splitting the backtest into two periods. Find where the money changed direction before you rewrite the entire strategy.
Why did the earlier profit disappear when you tested more trades?
Suppose the first 300 completed trades made $3,000 after costs. You then added another 2,700 trades, which lost $3,000. Across all 3,000 trades, the net result is zero.
Assume both periods used the same entry and exit rules, the same fixed position size, and the same cost method. One completed trade means a full round trip: an entry followed by an exit.
| Period | Completed trades | Net P&L | Average per trade |
|---|---|---|---|
| First period | 300 | +$3,000 | +$10.00 |
| Added period | 2,700 | −$3,000 | about −$1.11 |
| Total | 3,000 | $0 | $0.00 |
The first period made an average of $10 per trade. The added period lost only about $1.11 per trade, but it contained nine times as many trades. Those small losses gradually gave back everything the first period earned.
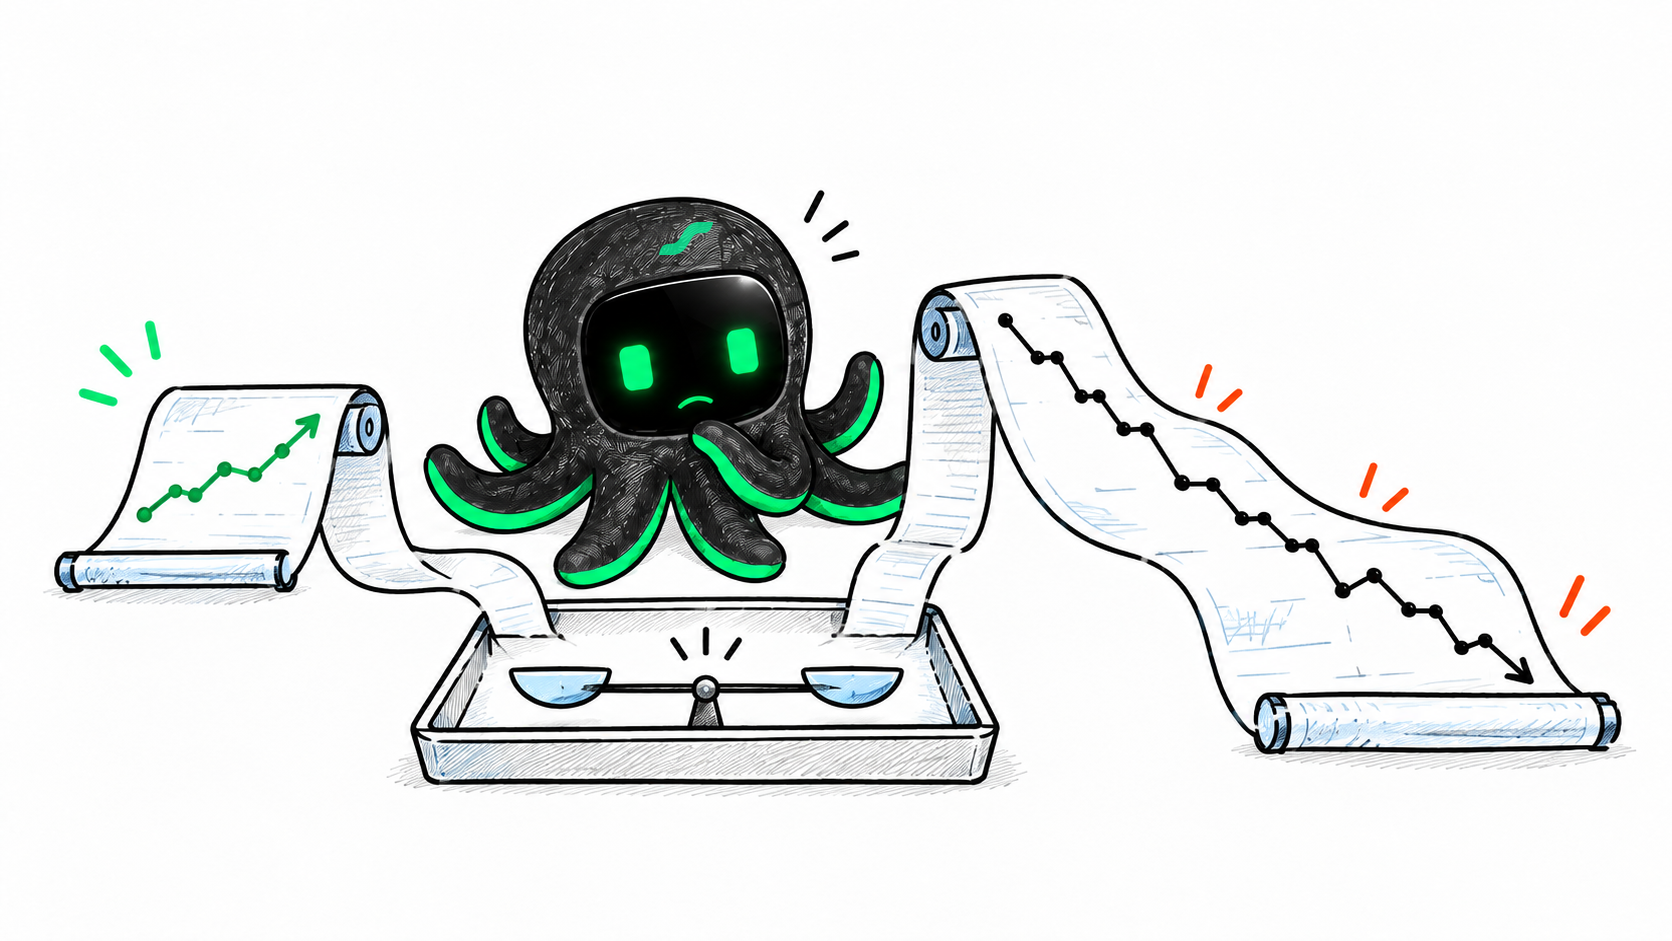
Think of a shop that makes money in its opening month, then loses a little in each of the next nine months. The problem is not that the owner kept too many months of records. The records revealed that the business stopped working later.
The same is true here. The extra 2,700 trades did not destroy the edge. They exposed a problem that the first 300 trades did not show.
When backtest profit disappears, should you inspect costs or the trading rules first?
You now know the added period lost about $1.11 per trade. The useful question is no longer, “Will a few more trades make the result look better?” It is, “What changed in the later period?”
Work through these four checks.
Did the later period lose money before fees?
First, calculate the gross P&L of the added 2,700 trades before costs. Then calculate the total fees, spread, slippage, and any other costs applied to those trades. Gross P&L is the result before costs; net P&L is what remains afterward.
If the later period was profitable before costs but unprofitable after them, inspect the cost assumptions first. If it was already losing before costs, the trade behavior deserves more attention. Fees may deepen a loss, but they cannot explain every weak strategy.
Also remember that an unchanged fee rate does not guarantee an unchanged cost per trade. Larger orders, different order types, lower liquidity, or longer holding periods can all increase total costs. And if a dataset already contains net returns, do not subtract the same costs again.
When did the strategy start struggling?
Arrange the trades by month. Look for the point where gains became smaller, losses became more frequent, or both. Then compare the market environment before and after that point.
For example, a momentum rule may perform well during a sustained rally and repeatedly buy high and sell low when the market becomes choppy. Verify whether the regime actually changed. Do not keep only the profitable months and then claim the strategy was “designed” for them.
Did a few outlier trades create most of the early profit?
Find the largest winners in the first 300 trades. Remove them temporarily and ask whether the remaining trades were still profitable.
If most of the gain came from a handful of trades, check whether those opportunities were likely to repeat. Also check whether they all occurred during one market move. A strategy can have many trades without having experienced many different market conditions—just as a shop can have many orders that all came from one large customer.
Were the first 300 trades used to choose the parameters?
Did you repeatedly adjust the parameters on the first 300 trades until the result looked good, then continue the backtest? If so, the first period helped select the settings. It cannot also serve as independent proof that those settings work.
The chosen parameters may simply fit that slice of history. This is the risk of backtest overfitting. Keep a record of every parameter set and dataset you tried, then test the selected configuration on data that was not used during selection.
Does a longer backtest automatically make the result more reliable?
No. Before adding older data, check for missing records, market-structure changes, and rule changes. Combining two incompatible datasets can produce a precise-looking but misleading result.
You may remove bad data when it is demonstrably incomplete or incorrect. “This period reduced my profit” is not a valid reason to exclude it.
How can you compare the two periods without mixing up the evidence?
The arithmetic is simple. The frustrating part is usually finding the right files: Which chart used which parameters? Did the fee assumption change? Where is the earlier result?
Put both result sets into one EdgePilot Research conversation and ask it to explain the differences and prioritize the next checks. A vague question such as “Is this strategy reliable?” gives the model too little to work with. Include the number of trades, the P&L for each period, the position-sizing assumption, and the cost method.
After you install and enable the official EdgePilot Research plugin, you can start with this prompt:
Analyze this teaching example with EdgePilot Research. The same strategy uses the same fixed position size and cost method in both periods. The first 300 completed trades made $3,000 net; the next 2,700 trades lost $3,000 net; all 3,000 trades therefore made $0 net. Calculate the average net result per trade for each period, then tell me what to compare first. Do not present these example figures as real strategy performance.
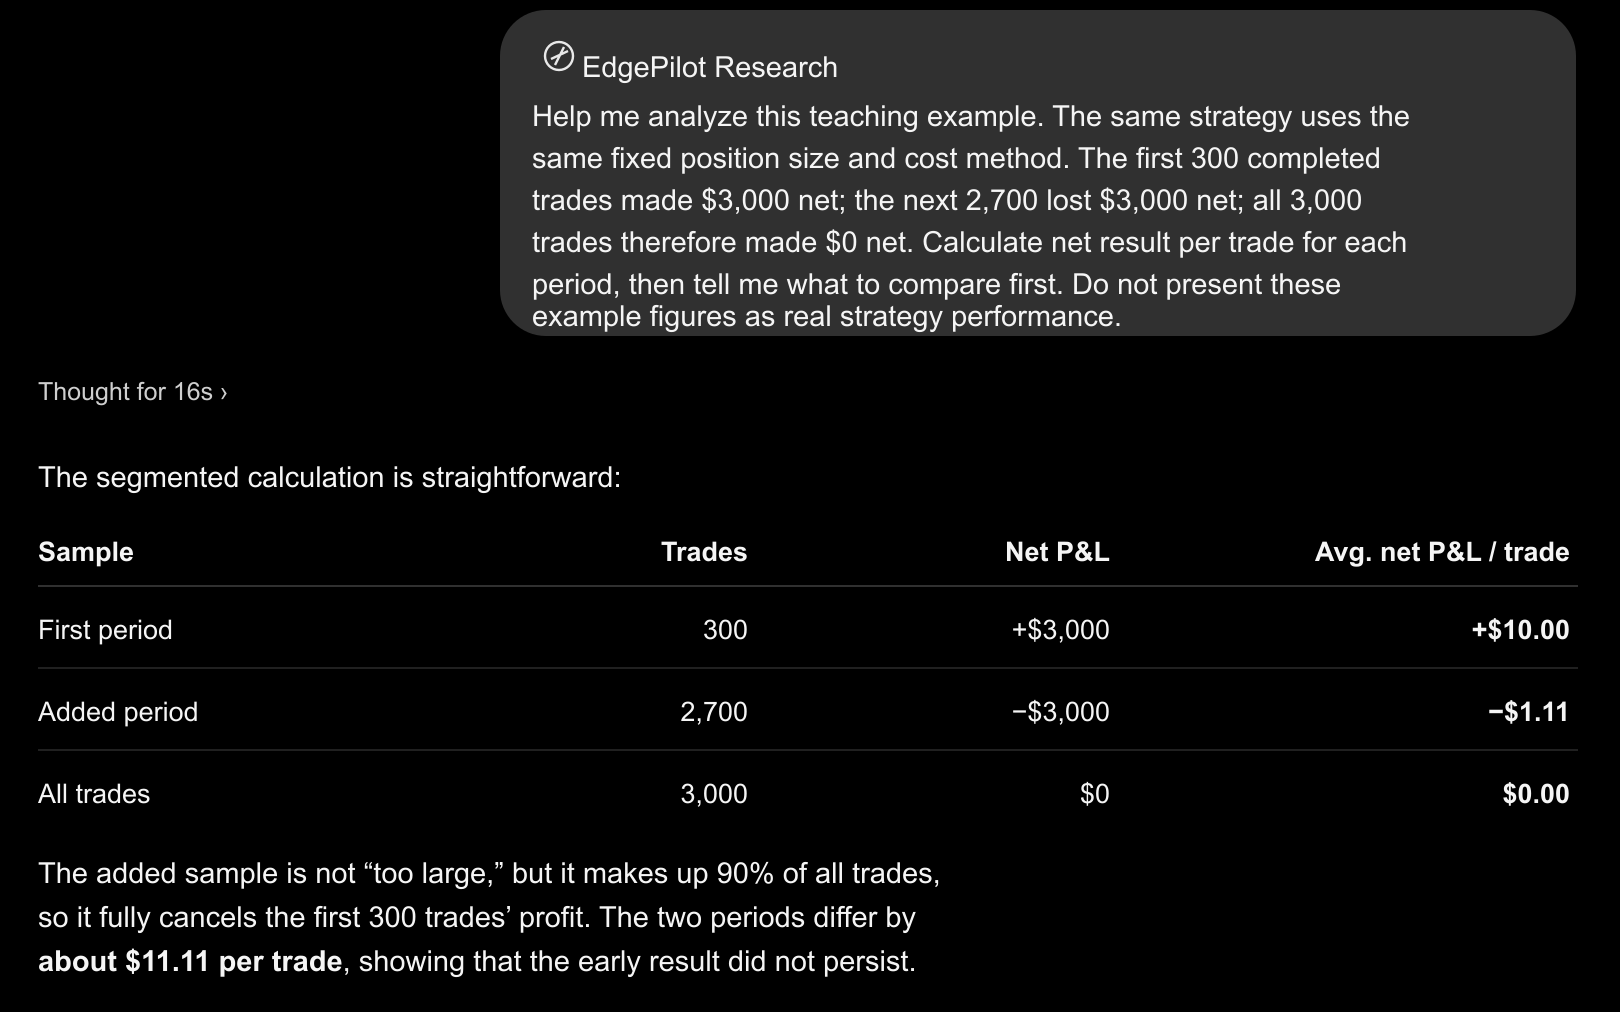
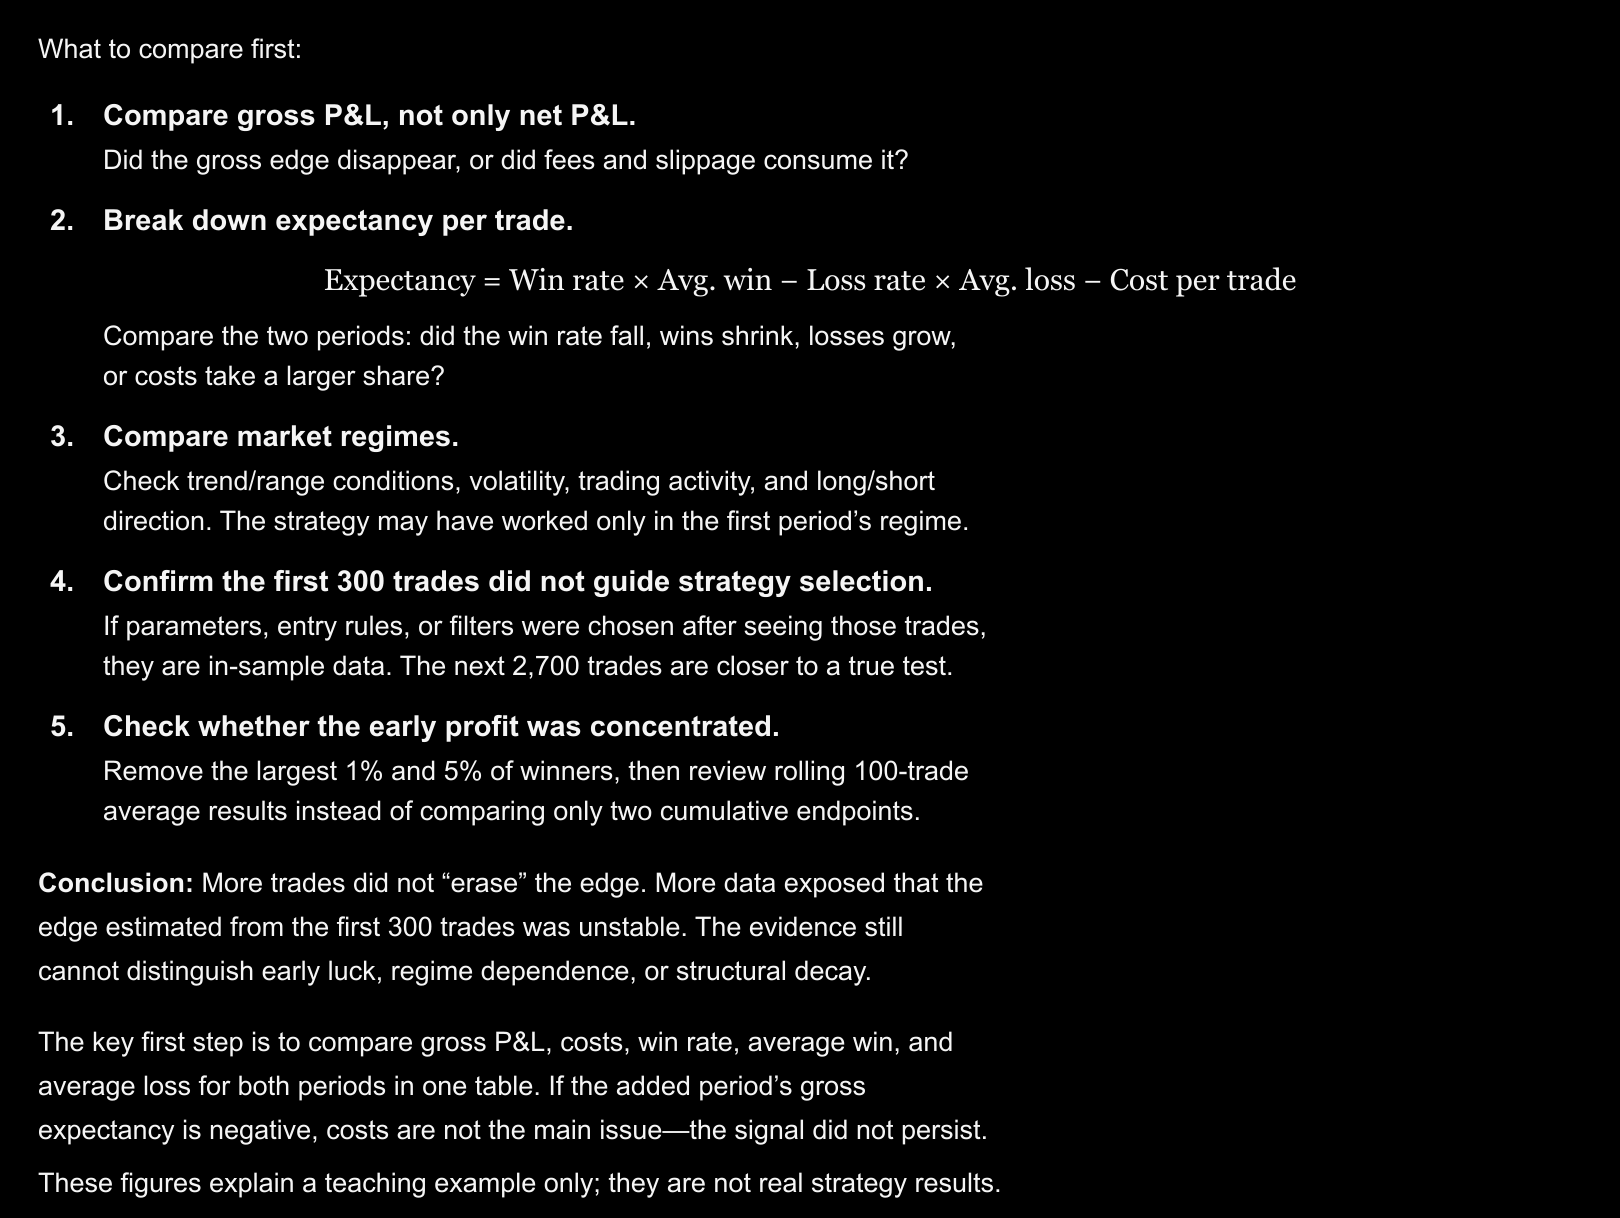
The calculation should come first: +$10.00 per trade in the first period and about −$1.11 per trade in the added period. The next questions are whether gross performance weakened, costs increased, the win/loss distribution changed, the market regime shifted, or the first 300 trades were used for parameter selection.
That gives you an actionable next step. Add the gross P&L and cost breakdown for the later 2,700 trades, then compare them with the first 300. You no longer have to stare at a zero total and guess.
| Bring this evidence | Ask Research to compare | Decide what to inspect next |
|---|---|---|
| P&L and costs for both periods | Did gross performance fall, or did costs rise? | Trade records or cost assumptions |
| Dates, markets, and trade direction | When did losses begin, and what changed? | Specific months or instruments |
| Parameters tried and datasets used | Did the early result influence parameter selection? | A fresh out-of-sample period |

If you are testing a reviewed research strategy package supported by Research, keep the strategy version, parameters, market, cost settings, and result together. When the next result arrives, you can compare it with the exact earlier setup instead of trying to remember what changed.
Find where the losses began before deciding what to change
This example does not show that strategies with more trades are useless. It shows that an early profit does not guarantee the edge survived later.
The additional 2,700 trades erased the original gain, but they also revealed something the first 300 trades could not. That is useful evidence—especially if you discover it before committing real capital.
If your backtest behaves this way, save both periods and compare them with EdgePilot Research. Find where the losses began, then decide whether to change a setting, improve the data, or test a different idea.
References
This article is for trading research and software-testing education. It is not investment advice. Historical and simulated results do not guarantee future performance.