Only One Parameter Set Made Money. Can You Trust the Backtest?
A tiny setting change wipes out the profit. Check nearby settings and fresh data before trusting the best-looking backtest.

You spend an afternoon tuning a strategy, finally get a profitable backtest, then change one setting slightly and the profit disappears. Did you find an edge, or just the one setting that got lucky? Before risking money on the answer, check nearby settings and a period you never used for tuning. That will give you a better reason to keep researching—or change direction.
Why does a small parameter change wipe out the backtest profit?
A parameter is a setting you can adjust. For example, a strategy might use a certain number of previous price bars to decide when to trade. Looking back a little further—or not quite as far—can change which trades it takes.
Suppose only that setting changes, with the same historical data, trading rules, and costs. The table shows one possible outcome: the settings on either side lose money, while the one in the middle makes a profit. The question is why such a small change makes a difference.
| Lookback in bars | Backtest result | What to investigate |
|---|---|---|
| 20 | Loss | One fewer bar: a loss |
| 21 | Profit | Only this setting makes money |
| 22 | Loss | One more bar: another loss |
Start with what that extra bar changed. Did it avoid a few losing trades? Did it catch one big rally? Until you can explain the difference, all you know is that 21 won this comparison. You do not know whether it will work in another period.
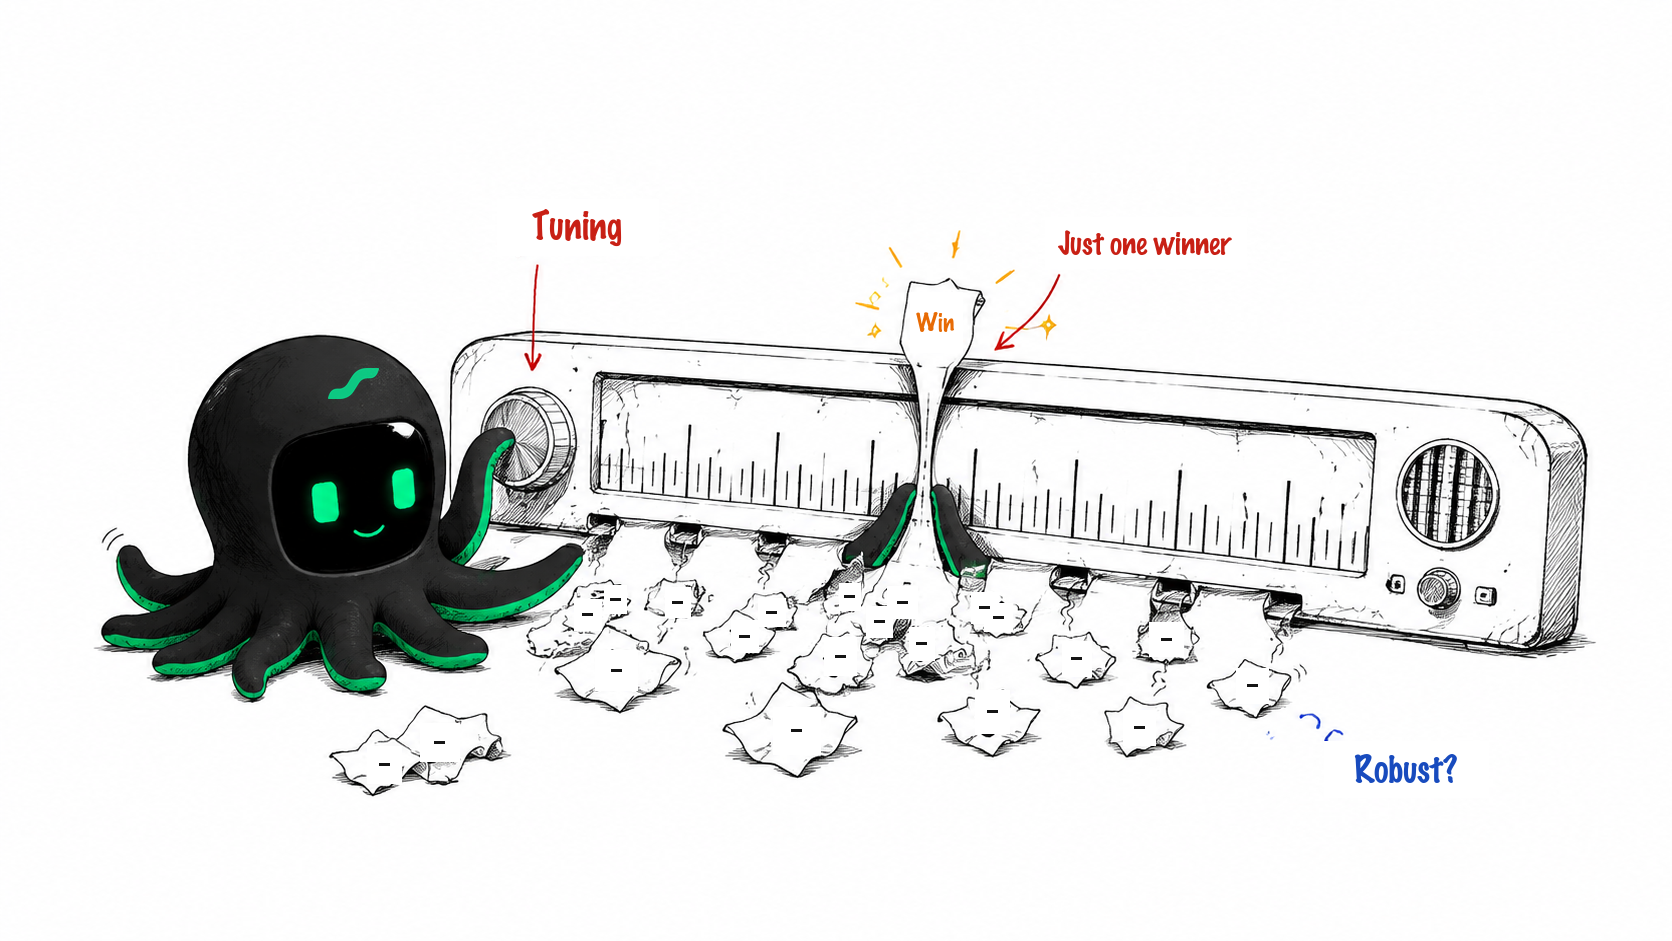
Take the same exam dozens of times, check the answers, and keep correcting your work. Eventually, the score looks great. The problem is that you have not taken a new exam. A strategy can do the same thing: fit the history you used to build it without working as well on new data. That is backtest overfitting.
Running experiments is not the mistake. Throwing away the failures and using the winner as proof is. Research on overfitting examines how the process of picking a result affects the result you end up showing.
How do you check whether the winning settings work on new data?
Save the current version first. Do not keep changing the rules while deciding whether they work. Each next test should answer a question, not just produce a prettier curve.
Check nearby settings, including the losers
Keep a table of every setting you tried. Record the dates, costs, returns, drawdowns, and trade counts. Drawdown is the drop from an earlier equity peak.
If 20, 21, and 22 all do reasonably well, that is different from only 21 making money. But look at the trades too. A small setting change may produce a very different set of entries and exits.
Try a period that played no part in tuning
Lock the rules, then test on data you did not use to choose them. This is an out-of-sample test: a fresh exam rather than another pass through the answer key.
If you see the result and tune the strategy again, that period has become part of development. You cannot keep calling it an untouched test after using it to improve the score.
If you retune regularly, test that process in time order
Choose settings using an earlier period, test them on the next period, then move forward and repeat. This is a walk-forward check. Each decision must use only the information available at the time.
The guide to using test data explains why this separation matters. Doing well on new data adds evidence. It does not guarantee future profits.
Check costs and the handful of trades doing the heavy lifting
Apply the costs you plan to use and see what profit remains. Then look at the biggest winners. If a few trades produced most of the return, investigate whether those opportunities show up elsewhere.
Does one profitable setting mean the strategy is useless?
No. Crossing a real rule threshold can add or remove a trade. If there are few trades, one big win or loss can change the whole result. The job is to explain the change, not automatically reject it.
The reverse is also true: several profitable settings can be the result of a long search. Keep the search history either way.
How do you compare dozens of backtest results?
After dozens of tests, it is easy to lose track of which settings produced which result. Keep each run’s settings and results together so you can compare them without mixing them up.
Bring the settings and results into an EdgePilot Research conversation. The AI can explain the differences and help you decide what to check next. Include the losing runs, not just the best-looking curve.
Enable the official EdgePilot Research plugin and start with this question, shown in the real conversation below:
Use EdgePilot Research to help me check this: I tried dozens of parameter combinations and only one made money. Can I trust that result?
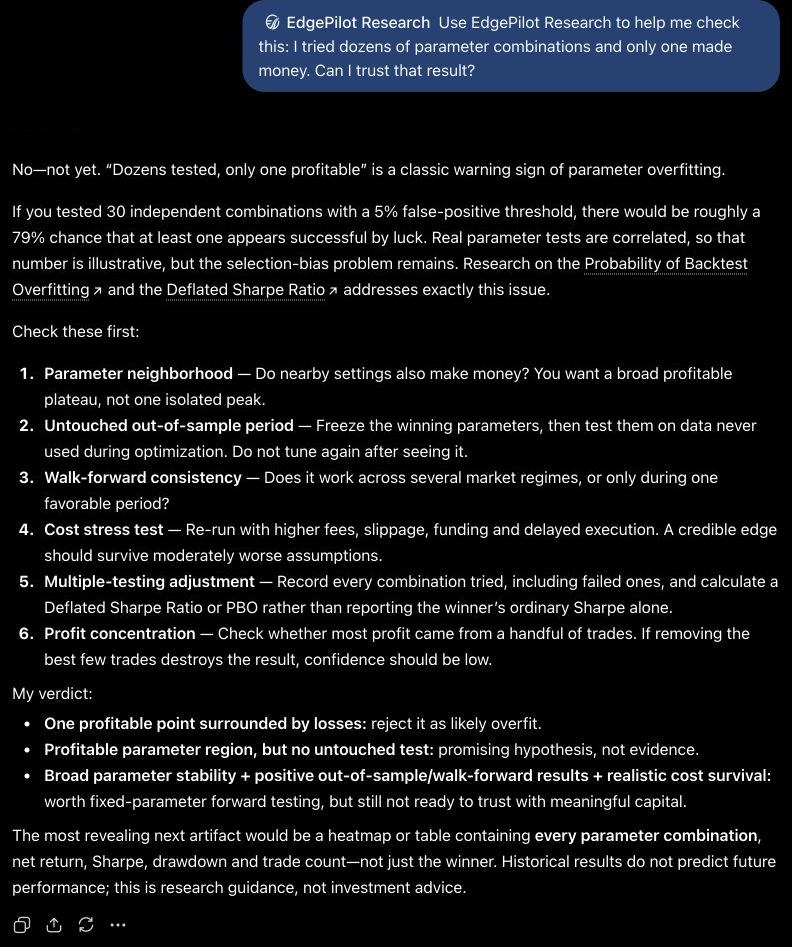
EdgePilot points to nearby settings, untouched data, walk-forward testing, costs, the number of trials, and unusually large winning trades. It asks for the full results table. In our example, that means bringing 20 and 22 alongside 21, then asking what changed in the trades.
The reply also uses a separate probability example. Suppose a test has a 5% chance of reporting an effect when there is none. Run 30 independent tests, and the chance of at least one false alarm is about 79%.
That is not a 79% chance that your strategy will fail. It illustrates why repeated testing matters. Real parameter trials usually overlap, and a profitable backtest is not the same as a statistically significant result.
Illustrative calculation: 1 − 0.9530 ≈ 78.5%.
This is the chance of at least one false positive across 30 independent tests, each with a 5% false-positive rate.
| You bring | Ask Research to explain | Decide what to check next |
|---|---|---|
| Every setting and its result | What changed between the winner and the other runs | Which changed trades to inspect |
| Data periods and tuning history | Which data you used to choose the settings | Which untouched period to test next |
| Costs and individual trade results | How much costs and a few big winners matter | Review costs or investigate the trading opportunities |
For supported, reviewed research packages, EdgePilot Research can also run historical backtests and retain the strategy version, parameters, market, fee settings, and results. That gives you a record of what you tested when you return to compare results.
What should you do after the reply?
If only one setting makes money, investigate which trades changed. If nearby settings also hold up, check whether you have tested untouched data. If several checks hold up, continue the planned research and keep the settings with the results.
How many parameter combinations are too many?
There is no universal safe number. It matters how similar the tests are, how much data you have, and how you choose the winner. A complete record of what you tried is more useful than an arbitrary limit.
Before tuning again, gather the settings and results you already have and review your parameter results with EdgePilot Research. Decide which question is worth testing next.
Related reading: Why trading costs wipe out backtest profits.
The next question is whether the settings survive data you did not tune on. Read how rolling validation keeps that test separate. For a concrete research starting point, browse the strategy library and inspect a candidate’s published evidence.
Sources
- Bailey and colleagues: The Probability of Backtest Overfitting
- scikit-learn: Cross-validation and time-series evaluation
- EdgePilot Research product overview
For trading research and software-testing education, not investment advice. Teaching examples are not actual strategy performance. Historical and simulated results do not guarantee future performance.