Why Does My Backtest Barely Make Money After Trading Costs?
A trade earns 12 basis points before costs. Fees, the spread, and slippage leave just 1. Here’s how to check what your backtest actually includes.
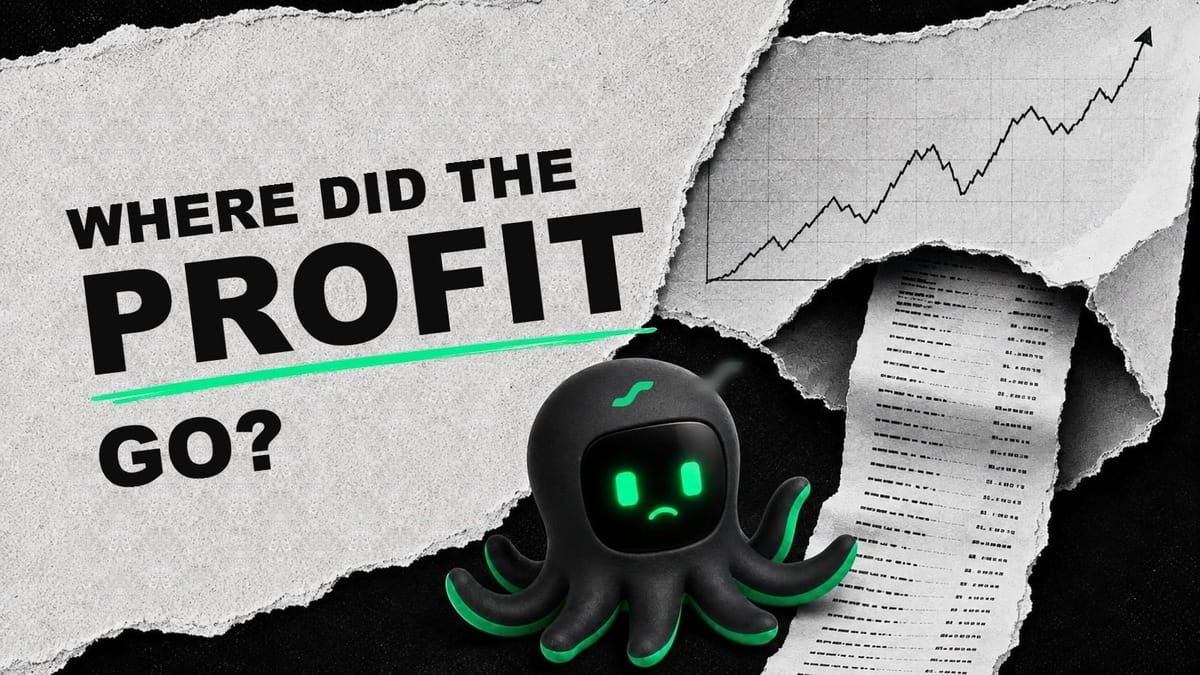
A backtest can look profitable until you add the trading costs it left out. When each trade earns very little, fees, the bid–ask spread, and slippage can eat most of the profit—and trading more often repeats the bill. So where did the money go? Start with one trade, then check how the backtest accounted for each cost.
The final return alone won't tell you what was included. You need to look at the assumptions behind the fills and the costs already deducted from the result.
Start with the math on one trade
Suppose a strategy earns 12 basis points before costs on a round-trip trade. A basis point is 0.01%, so that's a gross return of 0.12%. Opening and closing the position costs 6 basis points in fees, and the spread and slippage cost another 5. That leaves just 1 basis point, or 0.01%.
All three figures use the same trade notional as their denominator. These are illustrative assumptions, not standard charges for a particular market.
| Item | Change | Return remaining |
|---|---|---|
| Return before costs | +12 basis points | 12 basis points |
| Entry and exit fees combined | −6 basis points | 6 basis points |
| Spread and slippage | −5 basis points | 1 basis point |
That 12-basis-point gain was never all yours to keep. Under these assumptions, only 1 basis point survives. A slightly worse fill could wipe it out.
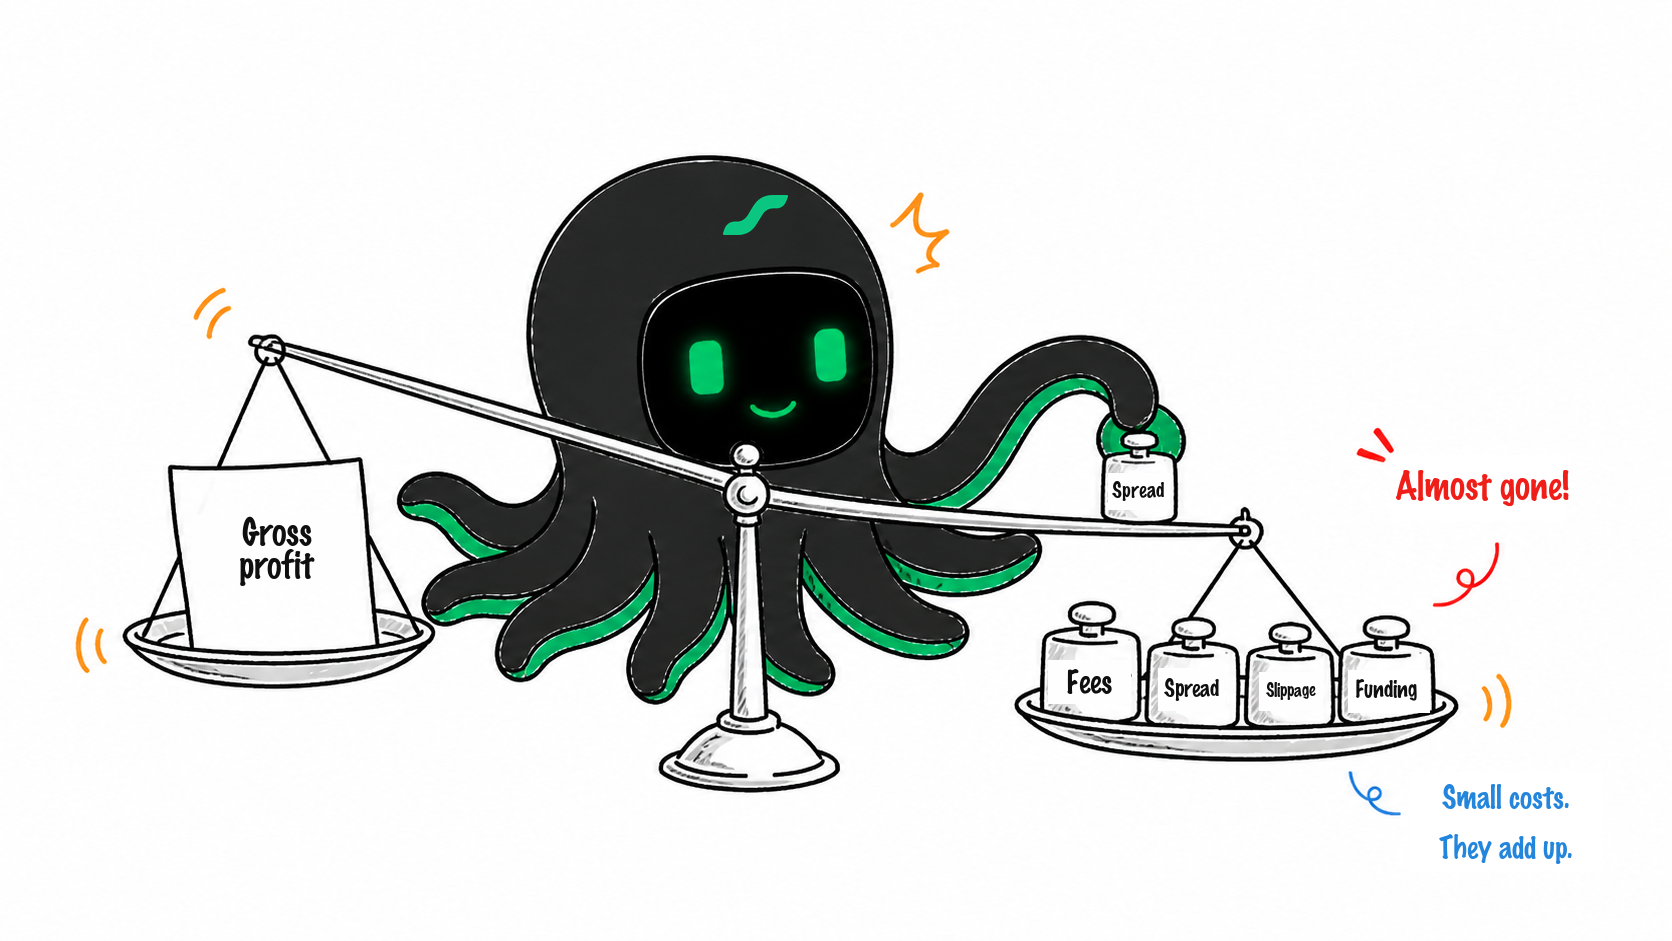
The example shows how a small profit gets squeezed. To work out whether your strategy still has an edge, you need to trace each deduction.
Check where the costs enter the backtest
- Separate trading fees, the bid–ask spread, slippage, funding, and any applicable borrowing or financing costs.
- Compare a baseline with more typical and stressed cost assumptions. Look at how much room the strategy has before its profit disappears.
- Check costs against traded value and turnover, rather than relying on win rate.
- Check whether the backtest fills limit orders too generously.
Count each cost once. If a cost is already reflected in the simulated fill price or deducted from the reported return, don't subtract it again. For example, if your slippage setting already accounts for the spread, adding the same spread separately would double-count it. TradingView's broker emulator documentation explains its commission and slippage settings, including the use of slippage to account for the spread.
Small slippage still needs evidence
What if you trade a liquid market, keep positions small, and use limit orders? Slippage may be less significant, especially for a low-turnover strategy. But check fills or order-book data before treating it as zero. “Probably small” is an assumption worth testing.
For a closer look at the individual costs, read how trading fees eat into profit and how slippage changes a backtest. Then bring both back into the same calculation.
How much of the edge do costs consume?
Compare the average all-in cost per completed trade with its average profit before costs. Use the same trades, currency, and cost definitions for both figures.
Share of gross profit consumed = average cost per trade ÷ average gross profit per trade × 100%.
In the example, costs consume 11 ÷ 12 × 100% ≈ 91.7% of the gross profit. Only 8.3% remains. That leaves very little room for worse execution.
This comparison assumes average gross profit is positive. If it is zero or negative, the strategy already needs attention before costs. If costs look implausibly large, check for duplicate deductions or a percentage-versus-basis-point error before blaming the strategy.
Run a small, controlled comparison
Keep the current code, parameters, and data version fixed, and save the order or trade records. Change one cost assumption at a time, then compare the result with the original. If a small, plausible change turns a profit into a loss, the strategy needs more testing before you commit real money.
That answers the question for one version. Change the parameters, market, or timeframe, and you need to check again. The time-consuming part is keeping the assumptions consistent as the strategy changes.
Make the next cost check easier
Calculating a fee once is straightforward. Keeping track of which fee assumptions went with which backtest is where things get messy. With spreadsheets and screenshots, it's easy to lose track of what changed between runs.
Bring the question to EdgePilot Research
EdgePilot Research helps you keep the strategy version, test conditions, and cost evidence in the same research workflow. That gives you a consistent starting point for comparing results after costs, instead of piecing the assumptions together again each time.
Install and enable EdgePilot Research in your AI workspace, then start with a question like this:
Use EdgePilot Research to help me figure out why this backtest barely makes money once all trading costs are included.
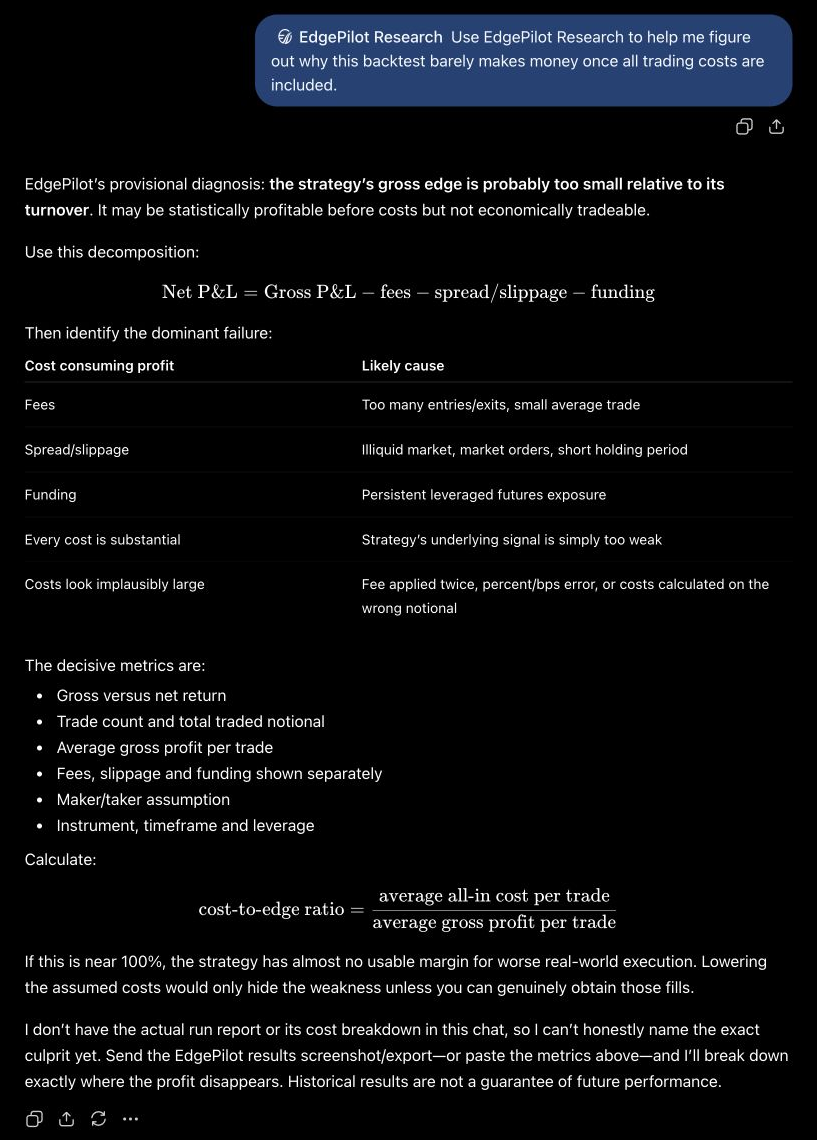
EdgePilot points to the relationship between profit per trade and trading frequency, then separates fees, spread and slippage, and funding into things to check. It also flags accounting mistakes such as counting a fee twice or mixing up percentages and basis points.
The next step is to provide the backtest report: profit before and after costs, trade count, fees, slippage assumptions, and funding charges. That turns the initial explanation into a check of your own numbers.
| What you bring | What EdgePilot helps check | Your next decision |
|---|---|---|
| Gross and net results, plus trade count | How much profit costs consume per trade | Whether the remaining margin warrants more testing |
| Fee settings and fill assumptions | Missing costs, double-counting, and unit mismatches | Which assumption to correct first |
| A fixed strategy version and comparable runs | How results change under different cost assumptions | Which comparison to run next |
Use the details to follow up
When reviewing a catalog strategy, start with its description, test period, return, and drawdown. The strategy-detail panel below is from EdgePilot Live. It shows the published summary you can use as a starting point before checking the underlying cost assumptions.
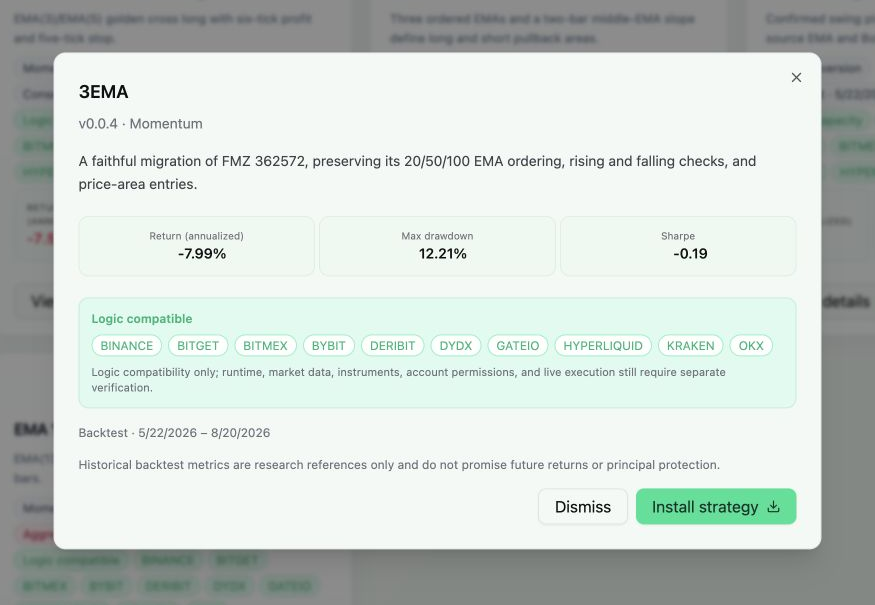
Keep the strategy summary alongside the detailed report. The useful comparison is between the costs assumed in the test and the costs relevant to the way you plan to trade.
Turn the findings into your next test
EdgePilot Research helps turn a vague question about returns into specific cost assumptions you can investigate:
- Check what the reported return includes. A profit factor is a ratio, not an amount of net profit.
- Identify any missing fee, spread, slippage, or funding assumptions.
- Rerun parameter comparisons on the same cost basis to see how much margin remains.
If you regularly change parameters, markets, or timeframes, keeping the questions and cost records together makes those comparisons easier to repeat. You can check whether the strategy still has room to work before spending more time tuning it.
Research is the place to work through historical results. When you're ready to test execution, EdgePilot Live extends the workflow to local paper trading, exchange demo environments, and live trading.
Have a backtest you're working on? Save the current version and its cost assumptions, then give EdgePilot Research a try. Start with one question: after every cost is accounted for, what's left?
The EdgePilot Research overview explains the historical-testing workflow and the reports you can keep for comparison.
If costs leave almost no margin, check whether repeated tuning produced a fragile winner. If the gap appears only after switching venues, compare the rules and execution conditions of the same grid.
Sources
This article is for trading research and software-testing education, not investment advice. The figures are illustrative and explain the calculation method.