Your Backtest Made 20%. What Is Left After Real Slippage?
In this worked example, a 20% backtest return falls to 10% with 0.05% adverse slippage per side—and reaches zero at 0.10%.
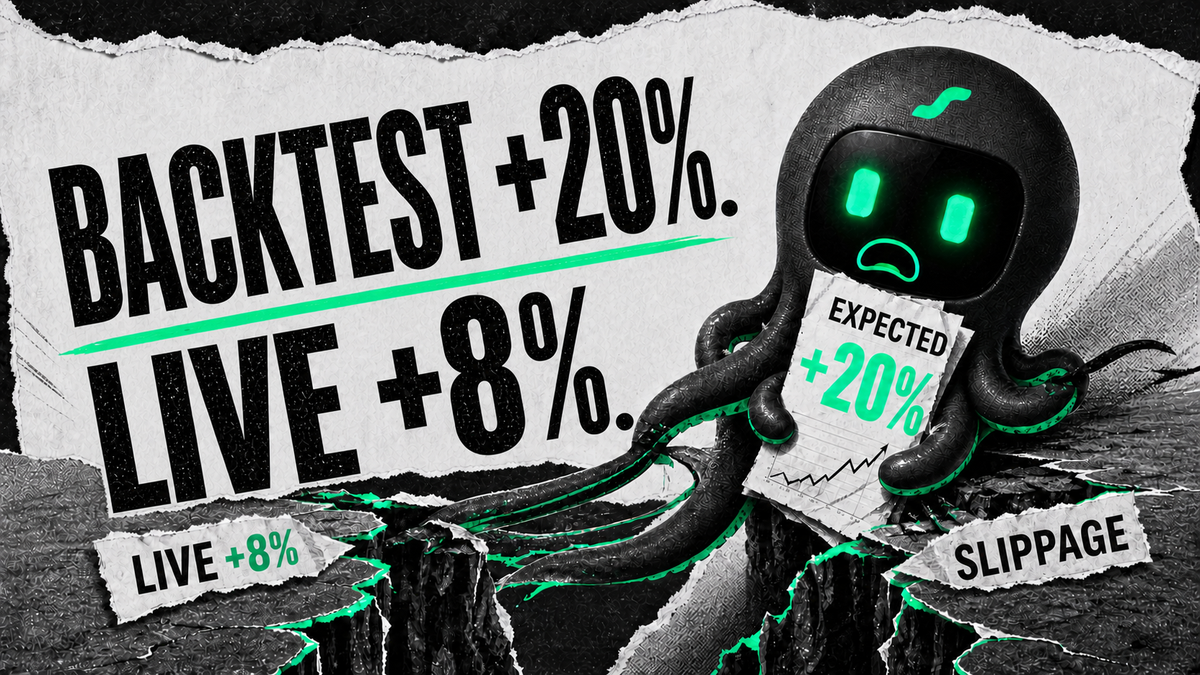
Here is the answer for the worked example below: a 20% backtest return falls to 10% when adverse slippage reaches 0.05% per side. At 0.10% per side, the profit falls to zero.
Backtests live in a beautifully polite market. The signal fires, the order fills at the price on screen, and nobody elbows past you.
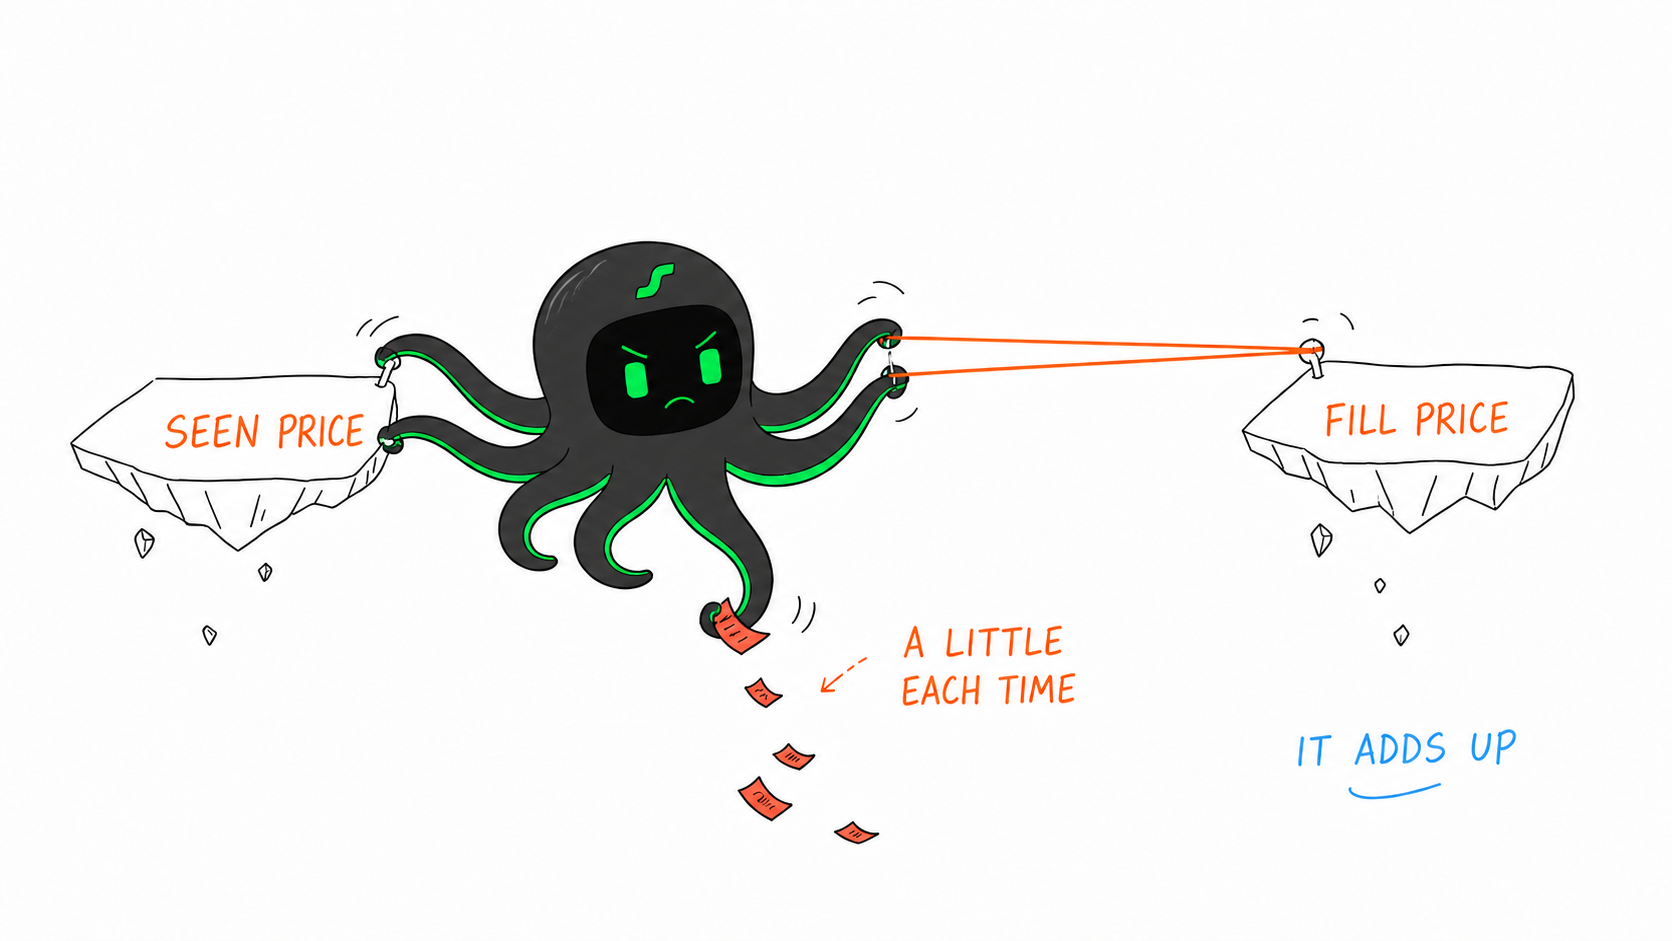
Live markets are less polite. You see 100, press buy, and get 100.05. On the exit, the market takes another bite. One miss looks harmless. Repeat it 100 times and the decimal point starts carrying a knife.
Slippage is not the same as a trading fee
A fee is an explicit charge under the venue’s rules. Slippage is the difference between the price you expected and the price at which the order actually executed. Spread is the distance between the best available bid and ask.
Coinbase explains that slippage can increase when liquidity or trading activity is low. See its current slippage and spread explanation.
In plain English: your screen shows one price, your fill arrives at another, and the space between them comes out of the strategy.
A first-pass stress test is simple:
Slippage cost ≈ trade value × adverse slippage rate
Add every “tiny” miss together and you get total slippage cost. This is useful for an initial sensitivity test, but it does not replace order-book, partial-fill, latency, or market-impact modeling.
How can 0.05% wreck a strategy?
Use this teaching scenario:
- 10,000 USDT starting capital;
- 10,000 USDT notional for each complete buy-and-sell round trip;
- 100 round trips, or 200 one-way fills;
- fees set to zero so we can isolate slippage;
- 2,000 USDT backtest profit, equal to 20% of starting capital;
- fixed trade size and no compounding.
| Adverse slippage per side | Cost over 100 round trips | Profit left |
|---|---|---|
| 0.01% | 200 USDT | 1,800 USDT |
| 0.05% | 1,000 USDT | 1,000 USDT |
| 0.10% | 2,000 USDT | 0 USDT |
| 0.20% | 4,000 USDT | −2,000 USDT |
At 0.05% per side, half the gross profit is gone. At 0.10%, the 20% return does not even make it out of the parking lot.
| Step | Calculation | Result |
|---|---|---|
| One round trip | 10,000 × 0.05% × 2 | 10 USDT cost |
| 100 round trips | 10 × 100 | 1,000 USDT cost |
| Profit left | 2,000 − 1,000 | 1,000 USDT |
The strategy did not suddenly forget how to trade. The backtest simply forgot to invite execution reality.
This is not a market average or a forecast. It only demonstrates how cost follows cumulative traded notional while headline return is often quoted against starting capital.
Why are short-horizon strategies so fragile?
They often combine three uncomfortable traits:
- a thin expected edge per trade;
- a high number of trades;
- a strong dependence on fast execution.
If a strategy expects 0.15% gross per round trip and loses 0.05% on both entry and exit, slippage has already consumed 0.10%. Add round-trip fees and the remaining edge may be mostly decorative.
Lower-frequency strategies may have wider targets, so slippage can be a smaller share of each trade. That does not make low frequency automatically better; holding risk, gaps, capital use, and missed opportunities still matter.
Is one fixed slippage assumption enough?
It is better than zero, but one number can still be a very tidy way to lie to yourself.
Slippage may vary with:
- liquidity in the trading pair;
- order size relative to available depth;
- market versus limit orders;
- volatility and news periods;
- signal-to-order and order-to-fill latency;
- partial fills, cancellations, and resubmission;
- many strategies trying to execute the same signal.
A Reddit user described the familiar gap between a backtest that assumes immediate fills and live execution affected by spread, latency, and slower APIs during volatility. That is an anecdote, not a universal estimate, but the failure mode is real enough to test. Read the discussion.

Backtest: “clean +20%.” Live fills: “best I can do is character development.”
Run a slippage stress curve instead
Test several scenarios—0%, 0.01%, 0.03%, 0.05%, 0.10%, and 0.20%—then ask:
- When does net return reach zero?
- When does drawdown exceed the acceptable limit?
- Which trades create most of the slippage loss?
- What happens to profit and cost when frequency falls?
- Does the strategy work only under near-perfect fills?
That last question matters. If a strategy makes money only when every fill behaves, it may not be a strategy. It may be a demo account wearing a lab coat.
The strongest objection: slippage can be favorable
Correct. A fill can be better than the expected price, particularly with limit orders or a favorable price move. Applying the same adverse slippage to every trade may be too pessimistic.
But a simple average can hide the opposite problem: execution often deteriorates precisely when volatility rises or liquidity disappears.
A stronger model uses real or simulated fill logs, groups results by market state, order type, and trade size, and reports neutral, adverse, and extreme scenarios separately.
How do you measure your own slippage?
Record at least:
- signal time and order time;
- expected price and actual average fill price;
- buy or sell direction;
- filled quantity;
- first-fill and complete-fill times;
- spread and available order-book depth.
For a buy, adverse slippage can be approximated as actual fill minus expected price, divided by expected price. Reverse the direction for a sell. Weight results by traded notional instead of averaging a 50 USDT fill and a 50,000 USDT fill as if they were twins.
How much of the backtest profit survives live trading?
The dangerous part is not that slippage exists. It is not knowing how much profit it removes.
An EdgePilot live-gap diagnosis could combine backtest results with real fill data to calculate how much profit disappeared, which trades caused the loss, and the slippage level at which the strategy turns negative.
If the backtest made 20% and live execution leaves 8%, “average slippage: 0.06%” is not a decision. This is:
Sixty percent of gross profit disappeared during low-liquidity periods and frequent small orders. Avoid those windows and remove low-value trades—or do not launch the strategy unchanged.
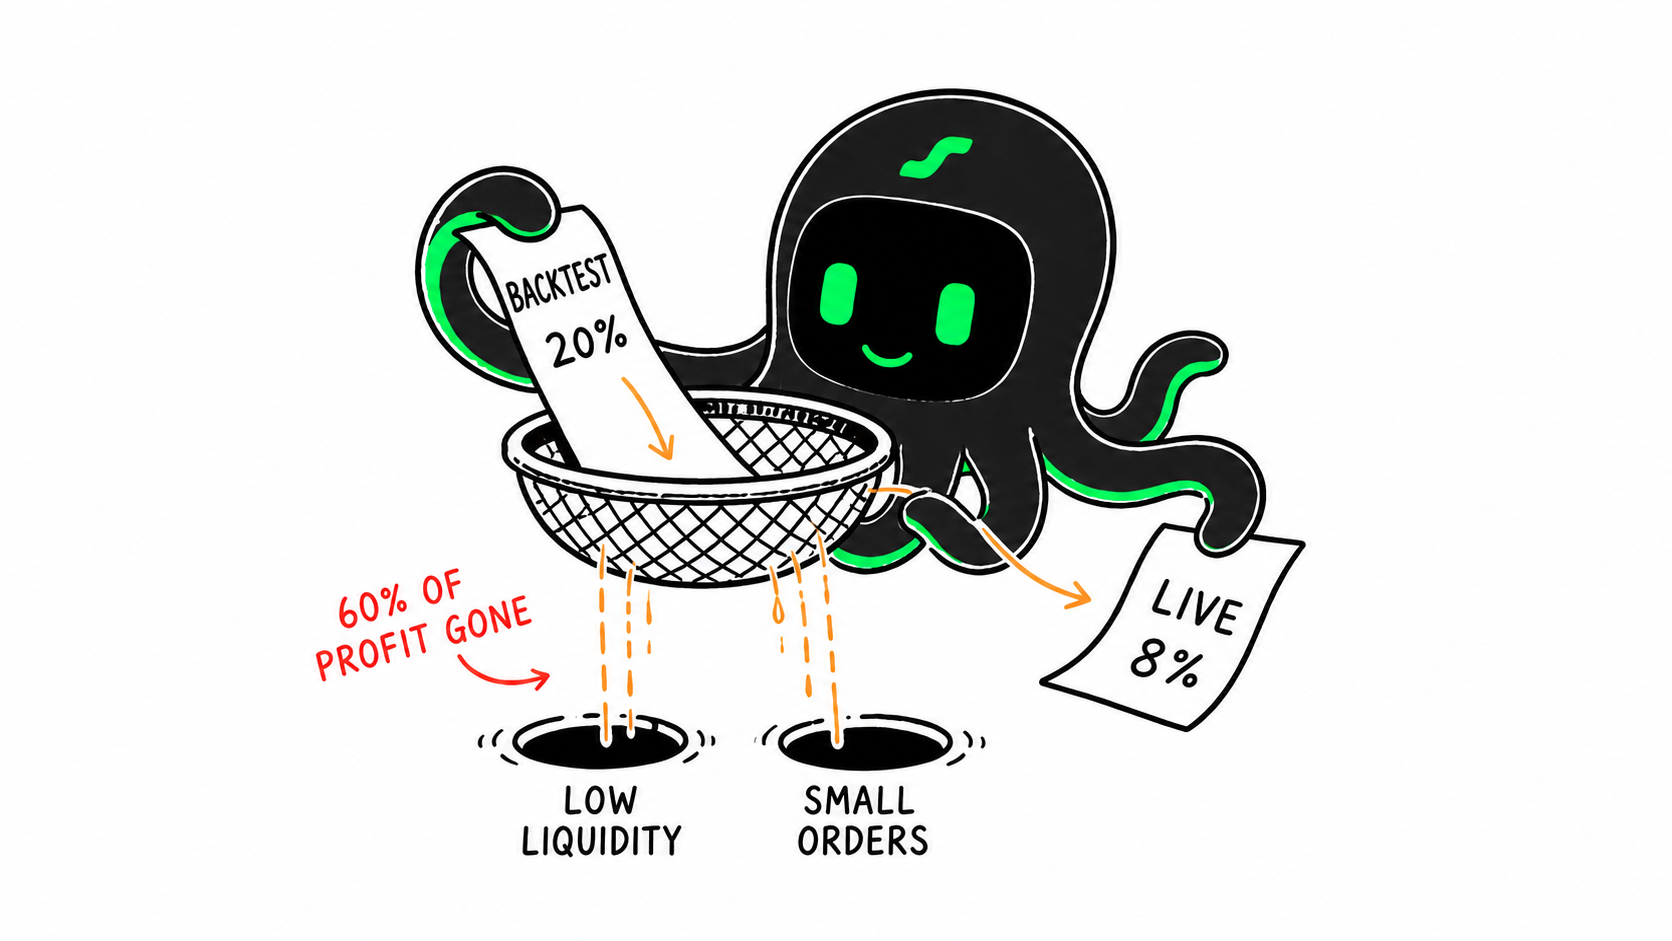
Testing 0.02%, 0.05%, and 0.10% scenarios can reveal the break-even boundary before live trading does the math with real money.
This live-gap diagnosis describes a planned EdgePilot capability. Availability and exact behavior depend on the released version.
FAQ
Is slippage a hidden exchange fee?
No. A fee is an explicit charge. Slippage is the difference between expected and actual execution price and can arise from liquidity, volatility, order size, and latency.
Can limit orders eliminate slippage?
They can cap the worst acceptable price, but they may not fill, may fill partially, or may miss the move. There is no free execution button.
What slippage value should a backtest use?
There is no universal number. Use several scenarios based on the pair, order size, order type, and actual fill history.
Can fees and slippage be added together?
They can be calculated separately and combined in one cost model, provided spread, fill price, and venue charges are not counted twice.
Start by calculating the round-trip trading fee, then check whether higher trading frequency amplifies the remaining edge or only repeats the cost.
One last line
Stop asking only what the backtest made. Ask: how much slippage kills the curve?
This article is for research and education only. The examples are static scenarios, not real-account results, market averages, or investment advice.
Put slippage back into the complete trading-cost picture. If the gap changes by venue, compare the same grid under different exchange rules. For the research workflow, see EdgePilot Research.
Sources
- Coinbase: Understanding slippage, spread, and liquidity
- Reddit: Backtest versus live-execution gap, used only as a pain-point example.