How Much Profit Does a 0.1% Trading Fee Really Take?
A 0.1% fee sounds tiny until it is charged on both entry and exit. On a 10,000 USDT round trip, a 30 USDT gross profit can shrink to 10 USDT before slippage.
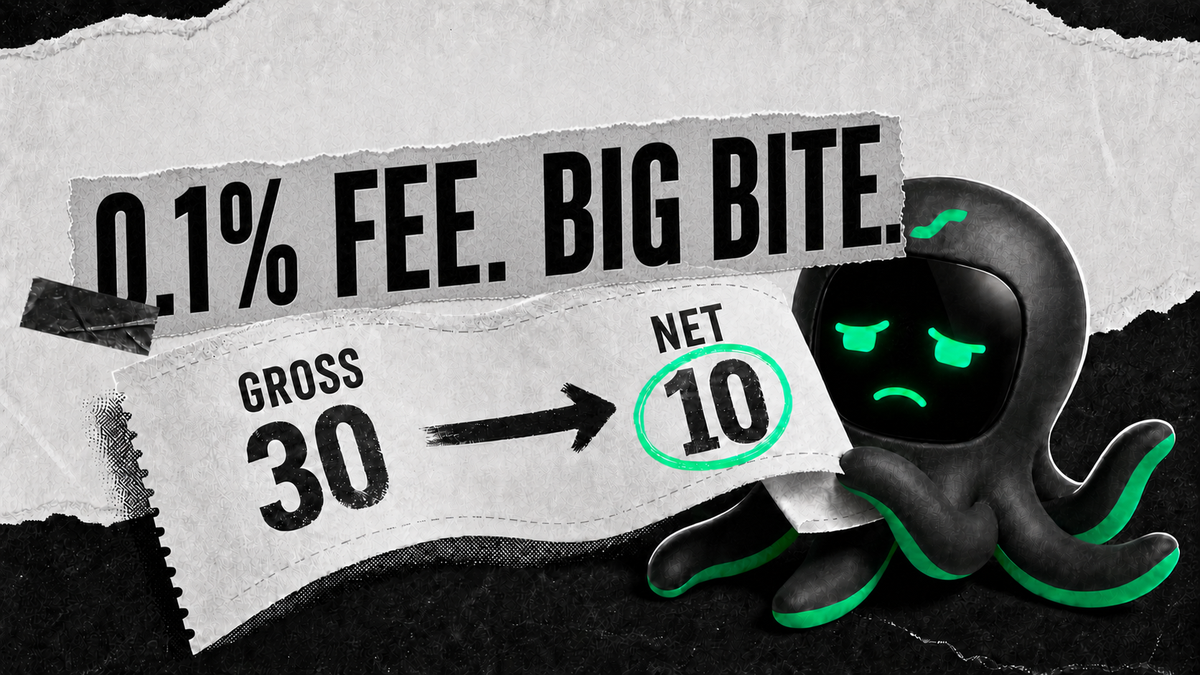
Here is the short answer: if you pay 0.1% to enter and another 0.1% to exit, one round trip costs roughly 0.2%. If the trade only makes 0.3% before costs, fees take two-thirds of the gross profit.
You watched the chart, tuned the signal, and made 30 USDT. The venue did none of that. It charged 10 USDT on the way in, 10 USDT on the way out, and left you with 10.
The strategy brought dinner. The fee schedule took the first two plates.
Why does 0.1% hurt so much?
Because what you call “one trade” usually contains two fee events: a buy and a sell.
In plain English: the turnstile charges you when you enter and remembers you on the way out.
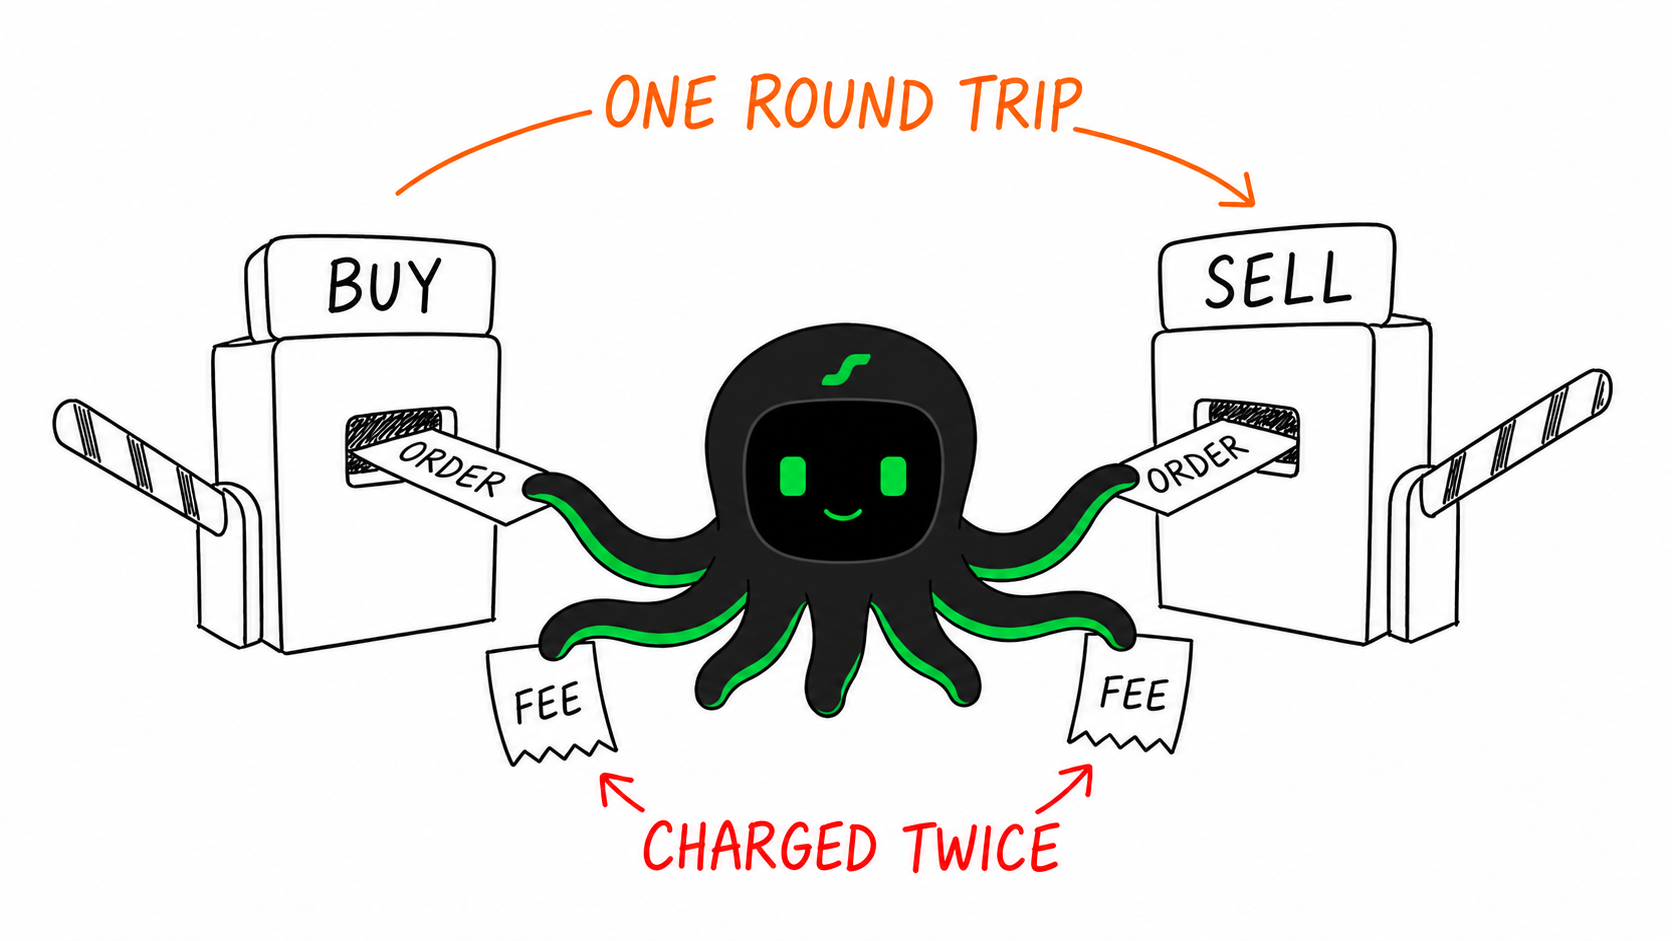
For a 10,000 USDT position with a 0.1% fee on each side:
| Step | Calculation | Cost |
|---|---|---|
| Buy | 10,000 × 0.1% | 10 USDT |
| Sell | 10,000 × 0.1% | 10 USDT |
| Gross profit | — | 30 USDT |
| Net after fees | 30 − 10 − 10 | 10 USDT |
That is the whole trick. The fee is small relative to the position, but enormous relative to a thin trading edge.
At this point the spreadsheet is not broken. It is simply showing you the bill you forgot to invite.
This is a static teaching example. It excludes slippage, bid-ask spread, funding, rebates, and fee discounts.
What happens when the trade count climbs?
Keep the same 10,000 USDT round trip and the same 0.1% fee on both sides.
| Round trips per month | Monthly fees | Simple 12-month projection |
|---|---|---|
| 5 | 100 USDT | 1,200 USDT |
| 20 | 400 USDT | 4,800 USDT |
| 100 | 2,000 USDT | 24,000 USDT |
The ugly number is not 0.1%. It is the 2,000 USDT monthly bill after 100 round trips. Fees follow trading volume, not whether those trades made money.
The annual figure is only the monthly number multiplied by 12. It does not assume that position size, frequency, or fee tier will actually remain fixed.
The exchange, watching another “just one quick trade”: excellent, keep cooking.
Does a limit order always get the cheaper maker fee?
No. A limit order that fills immediately may be treated as a taker order. A partially matched order may even pay taker fees on the immediate portion and maker fees on the remainder. Coinbase documents those distinctions in its current Advanced Trade fee explanation.
So do not model the cheapest number on the fee page and call it realism. Check:
- whether each fill was maker or taker;
- the fee tier that applied at that moment;
- discounts, rebates, or additional charges;
- whether partial fills split the order across fee types.
How much does a trade need to make just to break even?
A useful first estimate is:
Break-even move ≈ entry fee + exit fee
With 0.1% on both sides, the trade needs about 0.2% just to pay the explicit fees. That is not profit. Real execution may still include spread and slippage.
If the strategy expects 0.30% gross per round trip and pays 0.20% in round-trip fees, 66.7% of the gross edge is already gone. Add a little slippage and “small but consistent” can become “consistently paying the venue.”
Is trading less always better?
Also no. Fewer trades usually mean lower costs, but filtering out genuinely strong opportunities can reduce profit faster than it reduces fees.
The better question is: does the expected value of the next trade exceed its added cost?
That question is less exciting than a new indicator. It is also the one that pays the bill.
Check your own account instead of guessing
Export at least one month of fills and collect:
- notional value for each fill;
- actual fee paid and fee rate;
- maker/taker status;
- completed round trips;
- gross profit before fees;
- whether spread, slippage, and funding were measured separately.
Then calculate three numbers: total fees, net profit after fees, and fees as a percentage of gross profit.
Stop doing fee archaeology by hand
The useful product question is not “what is my win rate?” It is:
- How much of this month’s gross profit went to fees?
- Which trades looked profitable but were dead after costs?
- At the current fee rate and frequency, when does a small edge turn negative?
If a strategy makes 2,000 USDT gross and pays 1,000 USDT in fees, the result should not be another decorative dashboard. It should say:
Half your gross profit went to the venue. At the current fee rate, doubling this trading frequency could leave the strategy close to working for free.
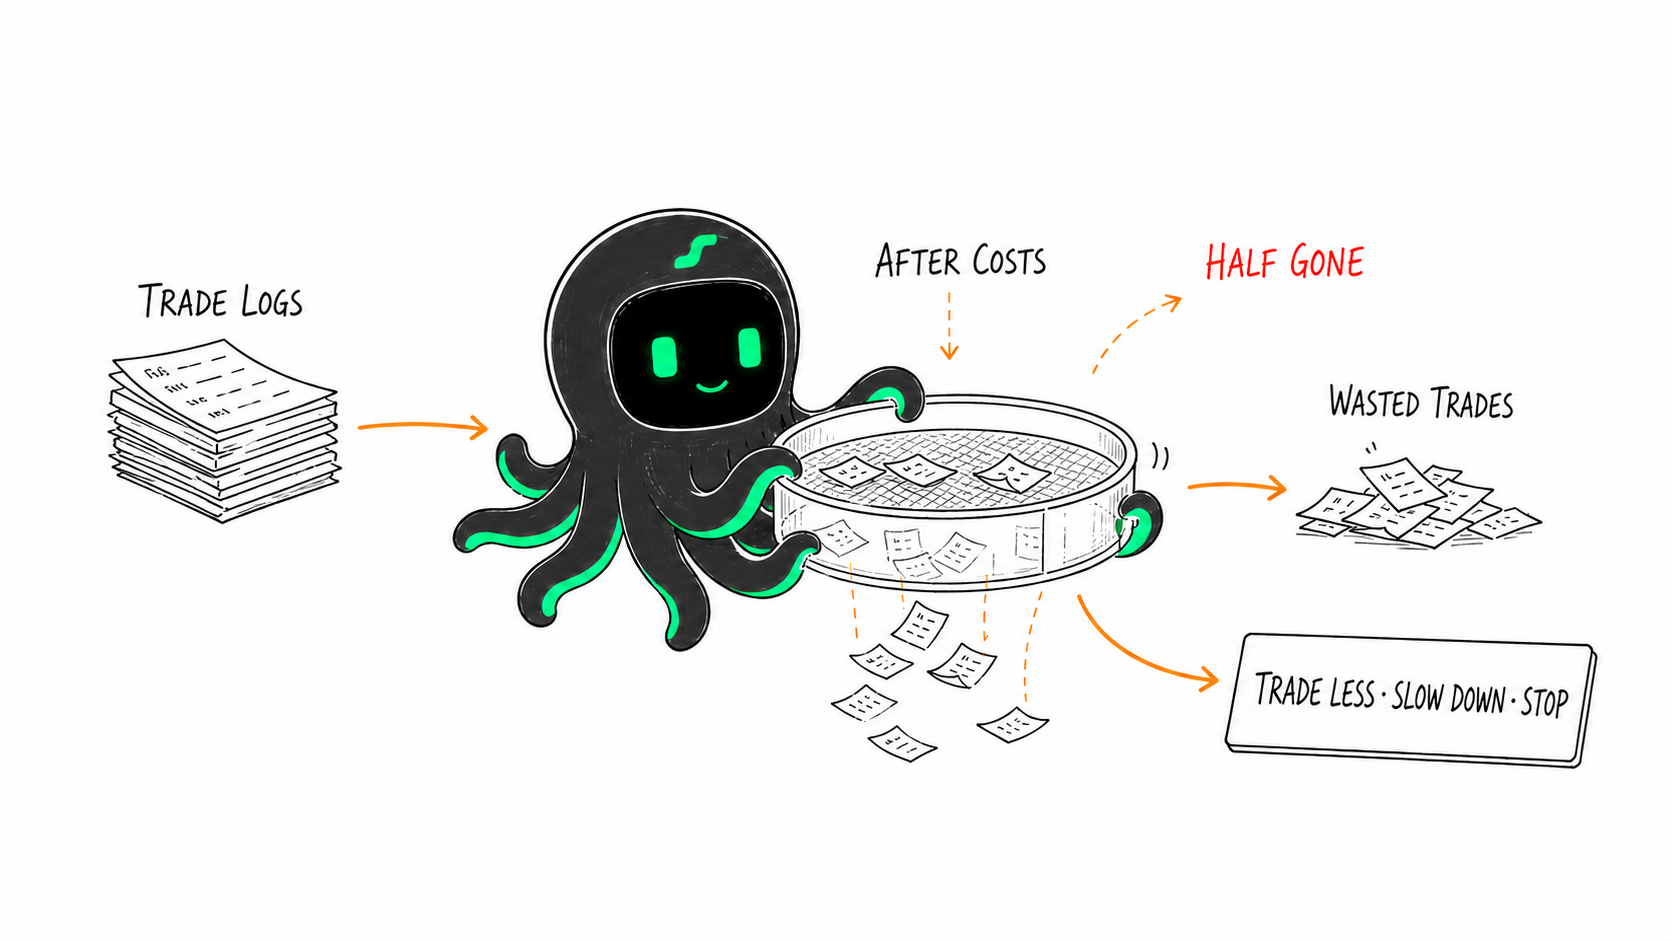
An EdgePilot cost diagnosis could combine trade logs, actual maker/taker fees, and scenario tests to show what remains at 0.05% versus 0.10%, then turn that into a decision: remove low-value trades, reduce frequency, or stop running a strategy whose edge does not survive costs.
This automated diagnosis and scenario testing describes a proposed EdgePilot product direction. Availability and exact behavior depend on the released version.
FAQ
Are trading fees charged on profit or trade value?
Trading fees are commonly calculated from trade value and the applicable fee rate, whether the trade eventually wins or loses. Check the venue’s current rules for the exact calculation.
Is every limit order a maker order?
No. A limit order that executes immediately can be a taker order, and partial fills can receive different treatment.
Why can a high-win-rate strategy still make little money?
Win rate does not show the size of wins and losses, and it does not include trading costs. Many tiny wins can be ground down by repeated fees.
Next, test whether slippage erases more of the backtest profit and whether doing more trades amplifies a positive net edge or a negative one.
One last line
Do not ask only how many basis points the strategy makes. Ask: after both sides pay the toll, how many basis points are actually yours?
This article is for research and education only. It is not investment advice and does not promise future strategy performance.
Fees are only one part of the bill. Continue with the complete trading-cost breakdown, then the Research plugin guide when you are ready to investigate your own assumptions.
Sources
- Coinbase: Advanced Trade maker/taker and fee mechanics
- Reddit: “Crypto Fees Eating Up Profits”, used only as evidence of the user pain point—not as an authoritative fee or return source.