High Return, Bad Strategy? Drawdown and Sharpe in Plain English
High return does not automatically mean a good strategy. Learn how return, maximum drawdown, and Sharpe reveal different parts of risk and performance.

Short answer: A high return is only the ending. It does not tell you how painful the trip was. To judge a backtest, read return together with maximum drawdown and the Sharpe ratio—then check the dates, costs, leverage, and assumptions. A big green number can still belong to a strategy most people would abandon halfway.
See “+24%” and your brain starts playing victory music. Fair enough.
Now ask what happened before the final screenshot. Did the account glide upward, or did it fall down the stairs, catch fire, and crawl back just before the test ended?
That is why one return number is not enough.
The three numbers, without the finance fog
- Return: How much did the strategy finish with?
- Maximum drawdown: What was the worst fall along the way?
- Sharpe ratio: How much reward did the strategy produce for all that bouncing around?
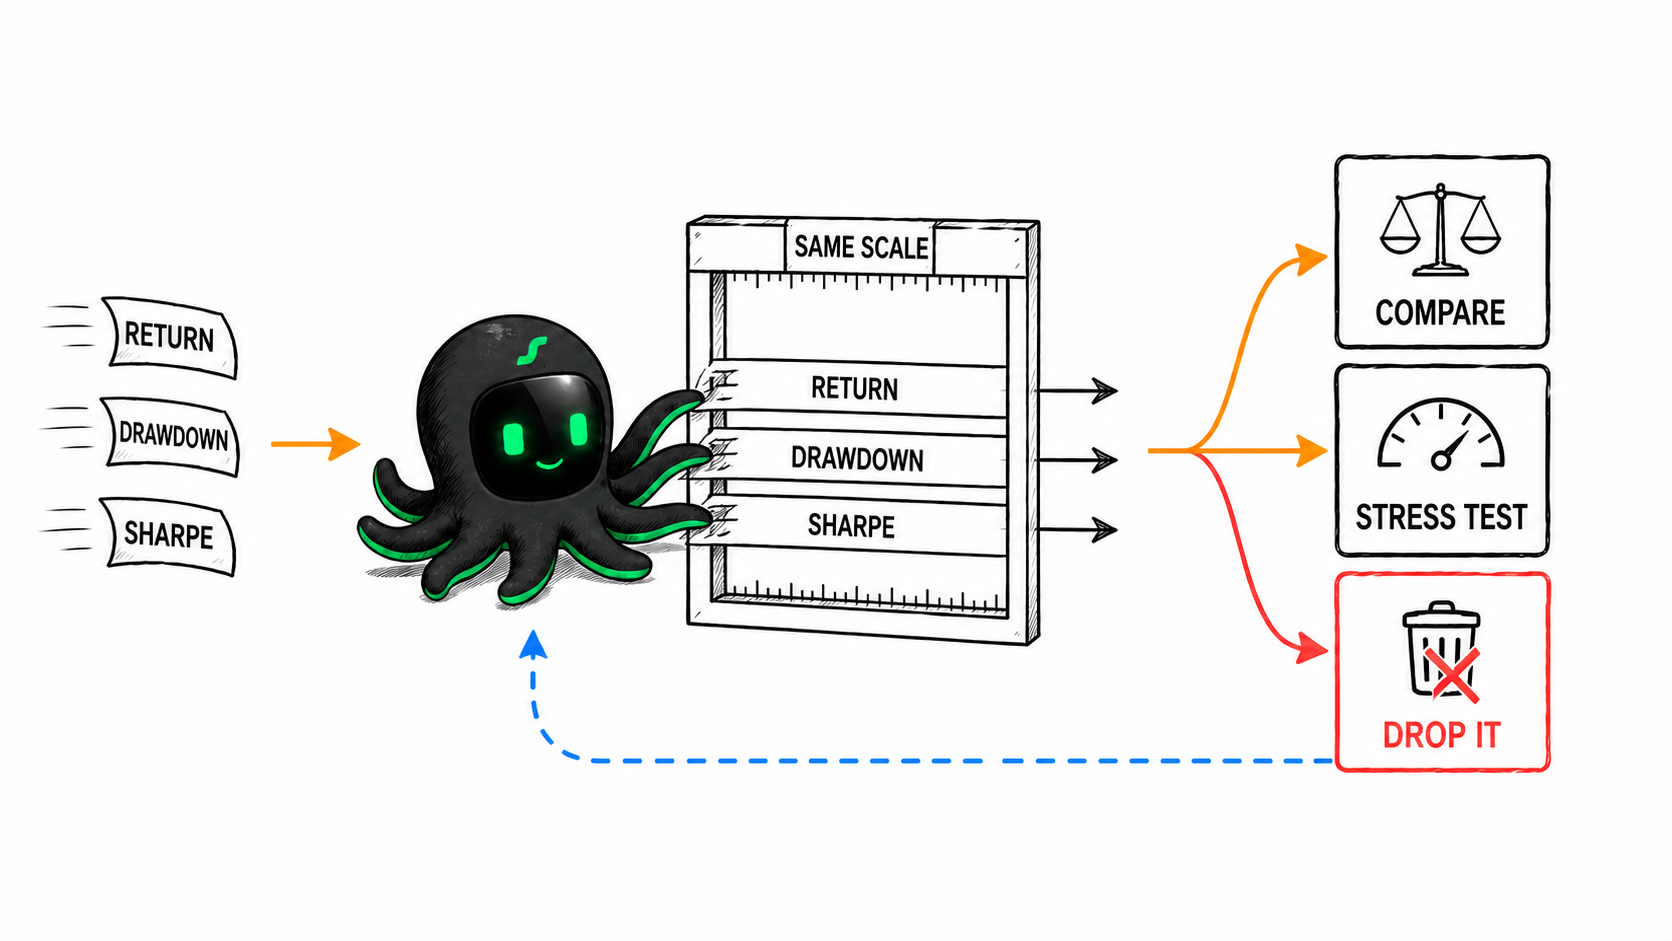
Think of them as the final score, the worst moment of the match, and the stress-to-reward rating. You need all three. You also need the same measuring rules.
Return: the final score
Return measures how much the value changed over a stated period.
Useful? Yes. Complete? Absolutely not.
A 30% return in one year is not the same as 30% over five years. A result before fees is not the same as a result after fees. A strategy using heavy leverage is not directly comparable with one that did not.
Whenever you see a return, ask four boring but money-saving questions:
- Over what dates?
- Before or after costs?
- Using how much capital?
- Using how much leverage?
The screenshot is the trailer. These questions are the full movie.
Maximum drawdown: how bad did it get before the recovery?
Your balance may recover. Your nerves might need longer.
Maximum drawdown is the largest fall from a previous peak to the next bottom during the test.
Suppose a portfolio reaches 100,000, falls to 70,000, and later climbs back to 100,000. The drawdown was 30%:
(100,000 − 70,000) ÷ 100,000 = 30%
The recovery does not delete the fall. It only means the strategy eventually returned to where it started.
There is another nasty little detail: after falling from 100,000 to 70,000, the portfolio needs to gain about 42.9% to return to 100,000. The hole is 30%, but climbing out requires more than 30% because you are now starting from a smaller base.
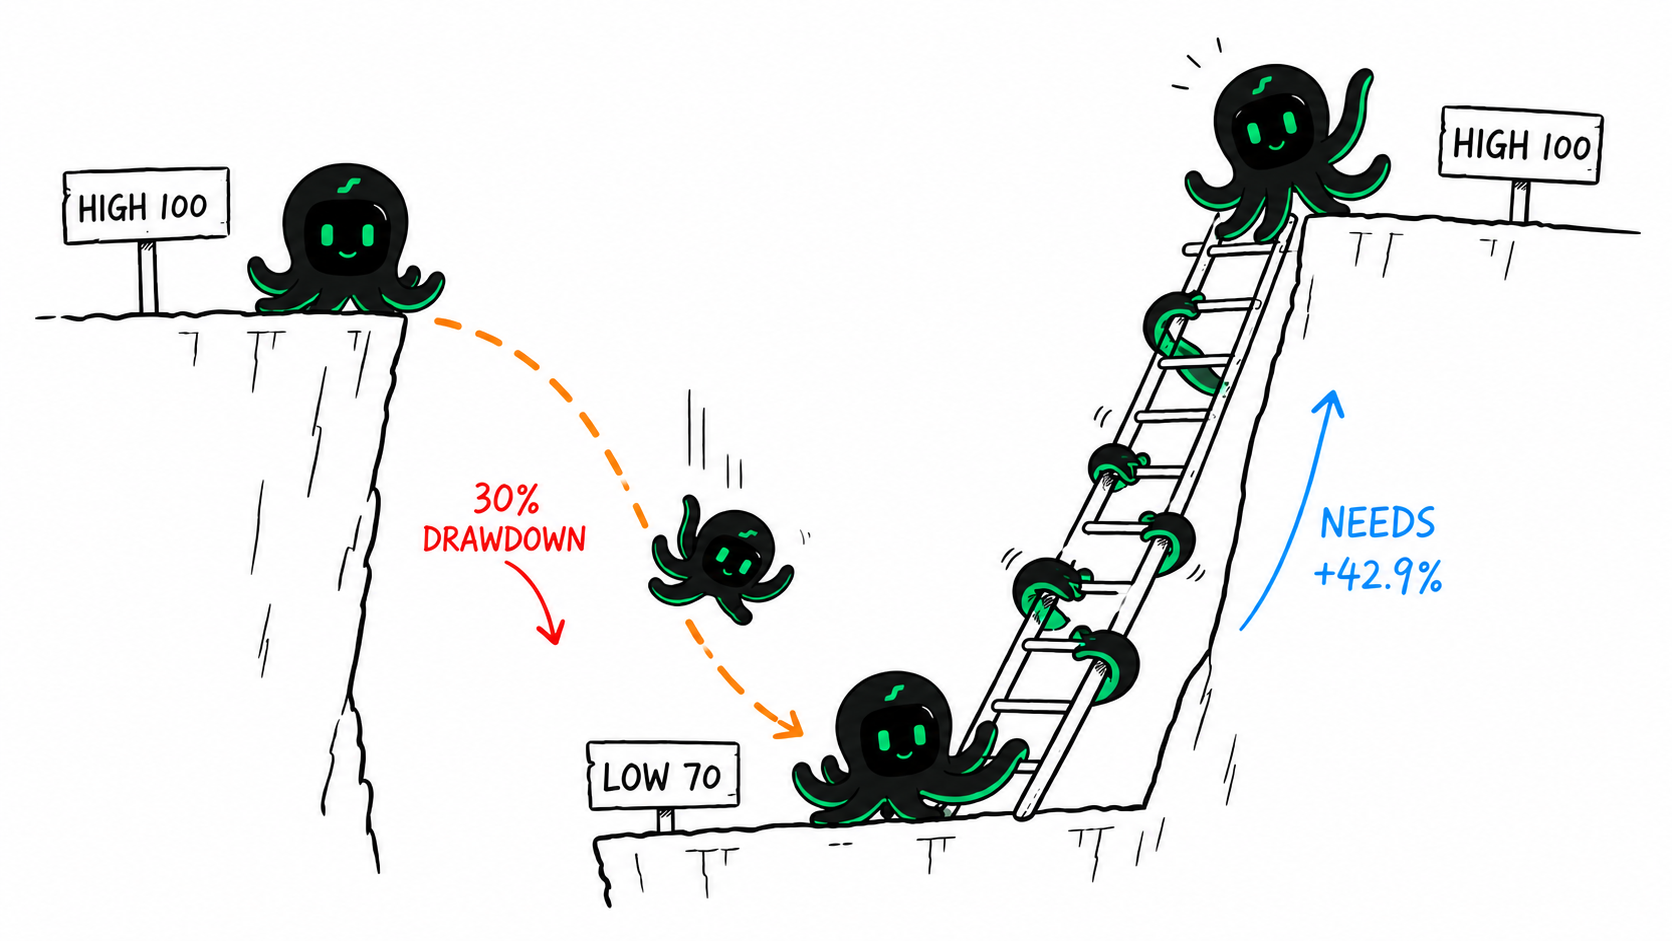
The line recovered. The cat did not forget.
Your spreadsheet calls this “drawdown.” Your stomach calls it “why did I open this app before breakfast?”

Sharpe ratio: reward per unit of chaos
William F. Sharpe described the ratio as differential return relative to its variability. In normal-person language: how much extra reward did you get for all the wobbling?
Imagine two drivers reach the same city. One takes a calm highway. The other takes a mountain road with three hairpin turns and one suspiciously missing guardrail. Same destination; very different blood pressure.
Sharpe tries to notice that difference.
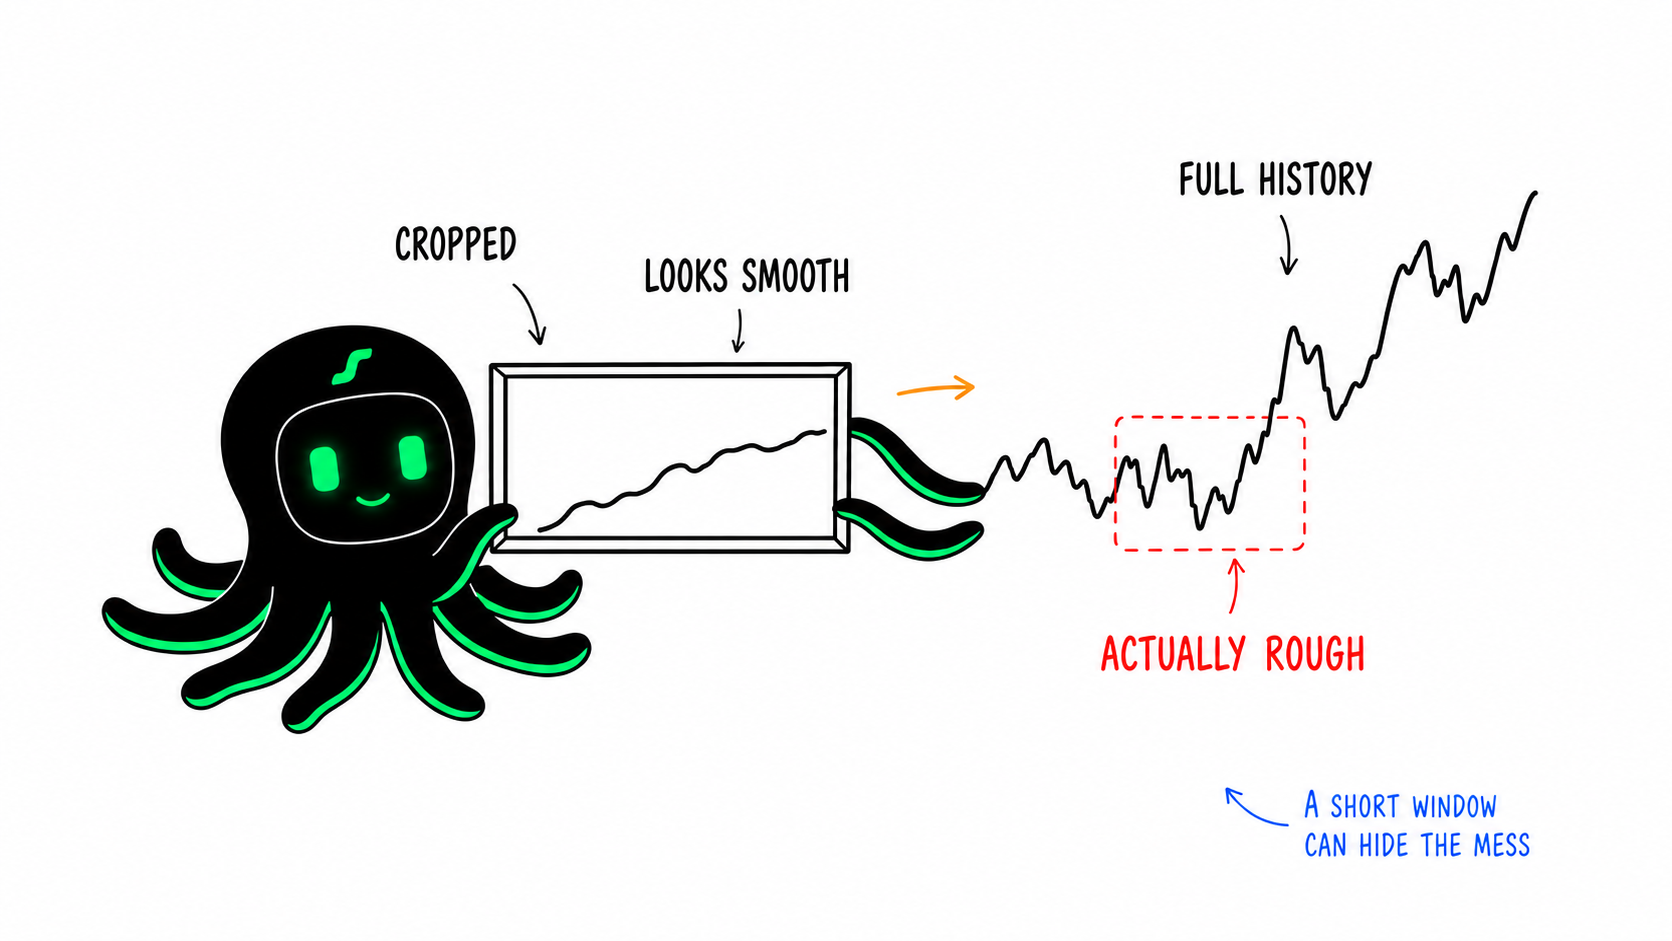
But Sharpe is a summary, not an X-ray. A high number can still hide rare crashes, depend heavily on a convenient time window, or become misleading when returns behave strangely. It is useful when two results use compatible dates, return frequency, benchmark, and calculation method.

If one website uses daily returns and another uses monthly returns, comparing their Sharpe ratios can be like comparing kilometres with “about twenty minutes from here.” Both sound measurable. They are not using the same ruler.
A simple example: more profit, more pain
Imagine two strategies tested over the same dates, with the same starting capital and the same costs.
| Strategy | Return | Maximum drawdown | Plain-English version |
|---|---|---|---|
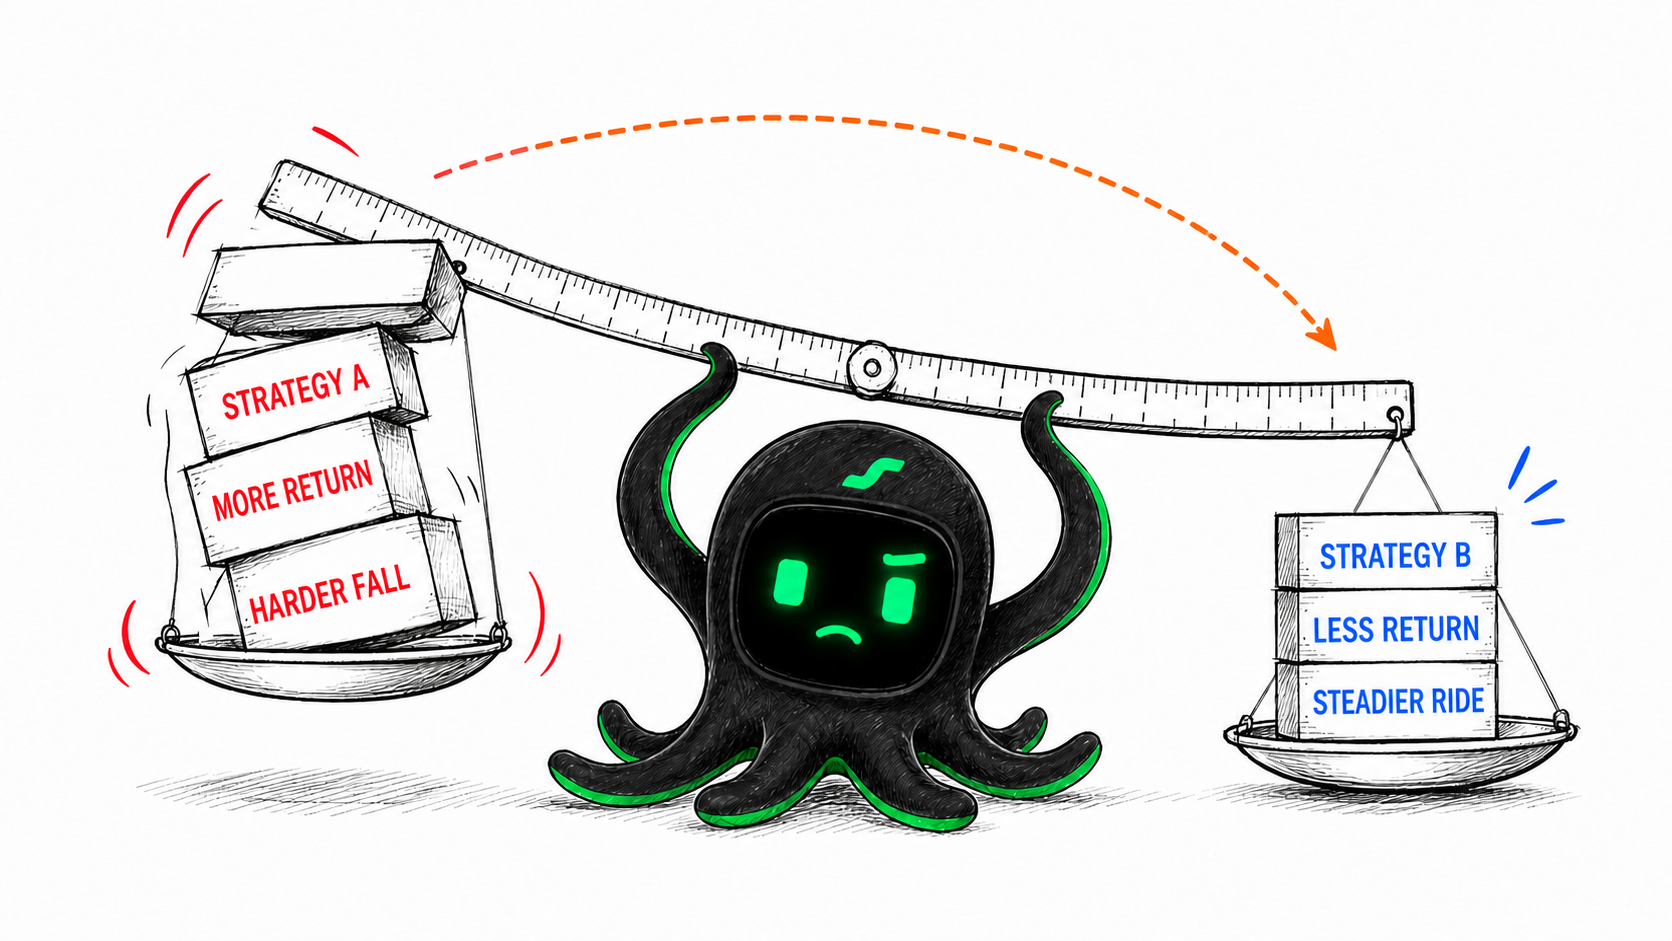
| A | +24% | −38% | Bigger ending, brutal middle |
| B | +16% | −9% | Smaller ending, calmer ride |
Strategy A wins the screenshot contest. Strategy B may win the “I would actually keep using this” contest.
Neither is automatically better. The answer depends on the user’s goal, time horizon, loss tolerance, and whether both tests are trustworthy.
These figures are hypothetical examples, not EdgePilot performance results.
When the numbers disagree, do not choose your favourite
Disagreement between metrics is useful information:
- High return + deep drawdown: the reward came with a rough path.
- Modest return + shallow drawdown: easier to hold, but costs could still erase the edge.
- High Sharpe + short sample: possibly impressive, possibly a carefully cropped selfie.
The answer is not to crown one metric king. Ask why the numbers disagree.
Five checks before believing the winner
- Were both strategies tested over the same dates and market conditions?
- Were fees, slippage, spreads, and funding handled the same way?
- Did both use comparable leverage?
- Was Sharpe calculated with the same return frequency and benchmark?
- Did the result survive different periods and small parameter changes?
If the comparison changes its ruler halfway through, the winner is mostly theatre.
Where EdgePilot Research fits
The official EdgePilot Research repository describes account-free strategy discovery and reproducible historical backtesting. It also states that EdgePilot Research does not connect trading accounts, accept exchange credentials, or place orders.
In plain English: it helps you inspect the homework. It does not turn a pretty backtest into guaranteed future profit, and it does not press the trade button for you.
FAQ
What is a “good” maximum drawdown?
There is no universal number. A tolerable drawdown depends on the strategy, leverage, time horizon, liquidity, and whether the user can realistically continue after that loss.
Is a Sharpe ratio above 1 automatically good?
No. The period, return frequency, benchmark, distribution, costs, and data quality all matter. A neat number cannot repair a messy test.
Can I compare Sharpe ratios from two websites?
Only after confirming that both use compatible inputs and methods. Otherwise, the numbers may look comparable while measuring different things.
Which metric should I check first?
Start with return, maximum drawdown, and Sharpe together. Then check the assumptions behind them. The metric without the setup is just a number wearing a suit.
Then verify that the result survived time-ordered rolling validation and remains credible after realistic slippage assumptions.
Ready to compare a real research candidate? Browse the strategy library’s public metrics, then open the Research overview. If one setting looks unusually good, check how parameter selection can flatter a backtest before treating it as the winner.
Sources
- The Sharpe Ratio, William F. Sharpe.
- Drawdown: From Practice to Theory and Back Again, Goldberg and Mahmoud.
- EdgePilot Research official repository, checked August 21, 2026.
For research and education only. This is not investment advice. Historical, simulated, and backtested results do not guarantee future performance.